 .pdf
.pdf
Results Overview
1. Single Building
This section focuses on a single building to examine its details. The goal is to understand the individual components and structure of a single building, providing a clear insight into the modeling and meshing process.
In this section, the result is obtained using:
./src/applications/ktirio_geom_app_building_lod1 --si ../../data/buildinglod1/config_create_building.json --r --volumeThe input files Z.dat and Z_weight.dat are used as poly_file and weight_file respectively. The parameters are set as follows: height is 9, roof_height is 0, and wall_thickness is 0.1.
1.1. Surface Mesh
For visualization purposes, the STL result is utilized. The surface mesh provides a detailed exterior view of the building, highlighting the structure and geometry.
|
|
|
video of the resulted surface mesh |
Surface Mesh |
Zoom on the floor separation of the surface mesh |
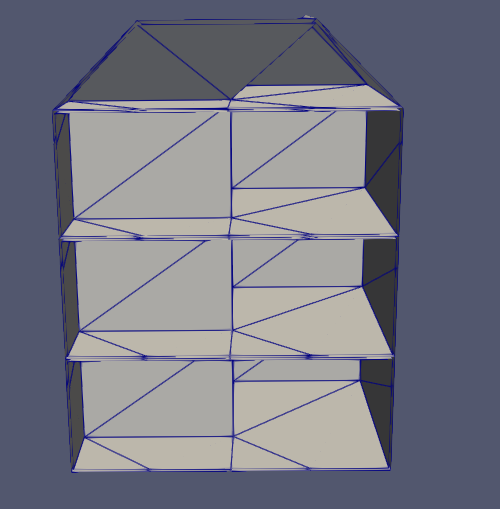
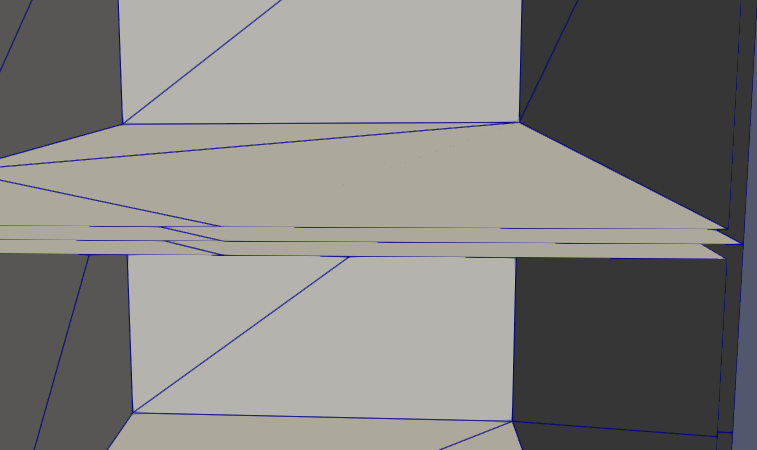
The video demonstrates the overall structure of the surface mesh, while the images provide a closer look at specific details, such as the separation between floors.
1.2. Volume Mesh
The volume mesh illustrates the internal structure of the building, providing insights into the spatial arrangement and material distribution.
|
|
|
video of the resulted volume mesh |
Volume Mesh |
Zoom on the floor separation of the volume mesh |
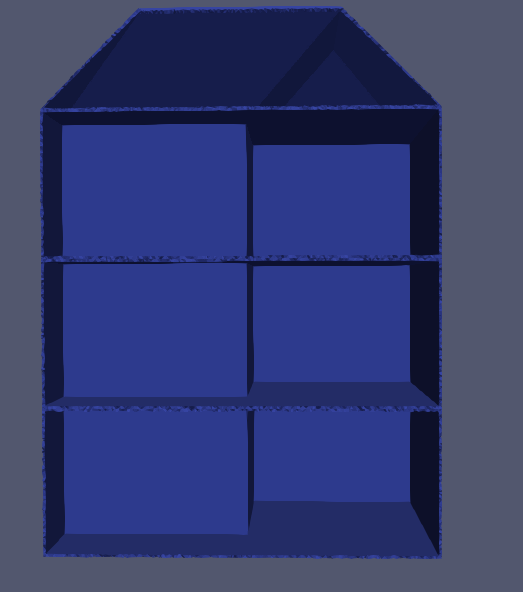
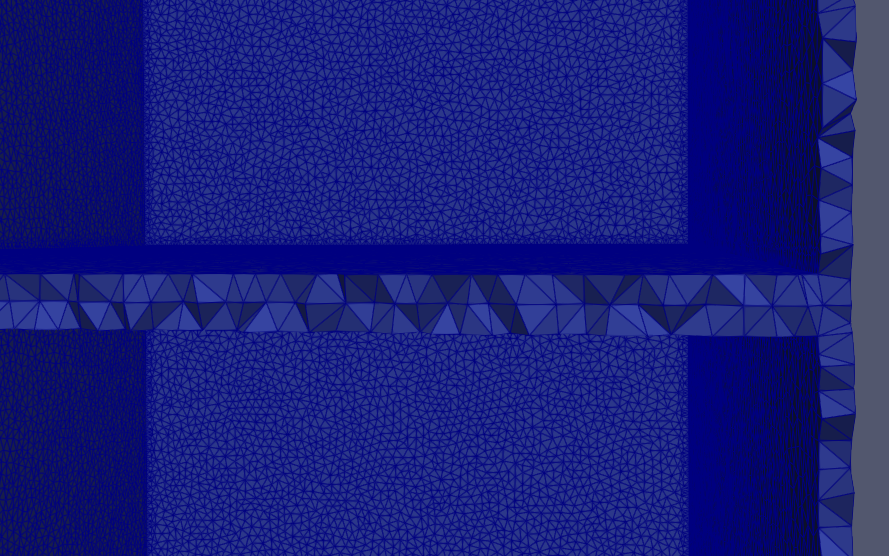
The video highlights the volumetric aspects of the building, while the images show detailed views of the internal separations and volume distributions.
1.3. Markers
Markers are placed on every surface of the mesh. Internal walls are marked with internal_wall and external walls with external_wall. Floors and roofs are marked, and each vertical face is numbered based on the order of the polygon points. This marking helps in identifying and differentiating various parts of the building.
The markers are compatible with the original marking provided.
|
|
|
Marked Surface Mesh |
Internal wall |
Vertical Faces 1, 3, and Roof |
The images showcase how markers are used to distinguish different surfaces and structural elements, facilitating easier identification and analysis.
2. Multiple Buildings
This section discusses the creation and analysis of multiple buildings simultaneously. By examining multiple buildings, we can observe how different structures interact and compare their respective features.
The results in this section are obtained using:
./src/applications/ktirio_geom_app_building_lod1 --i ../../data/buildinglod1/gis.json --r --volume2.1. Surface Mesh
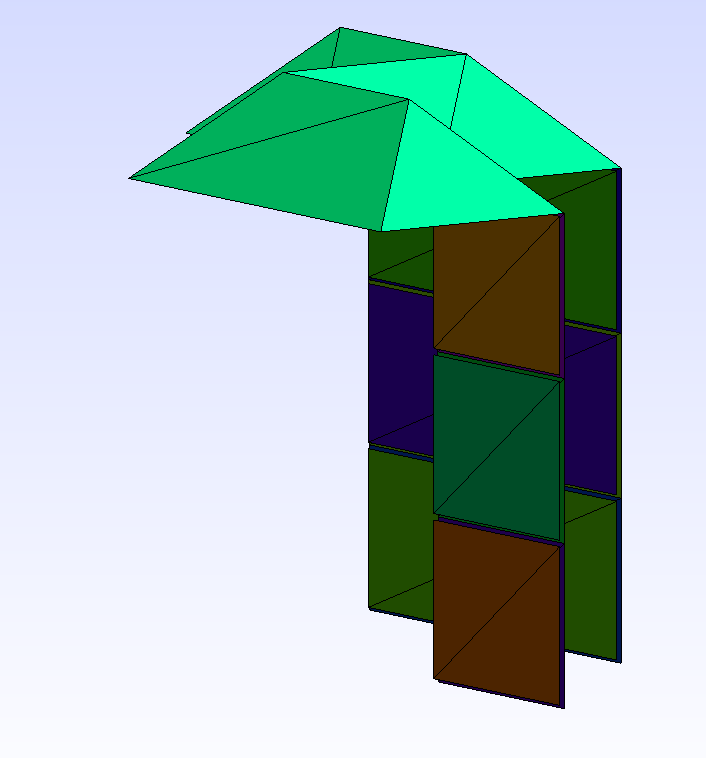
The surface mesh for multiple buildings highlights the structure of each building and how they relate to each other within a shared environment.
|
|
|
Marked Surface Mesh of Two Buildings |
Internal walls of Two Buildings |
Floor 0 and Roof of Two Buildings |
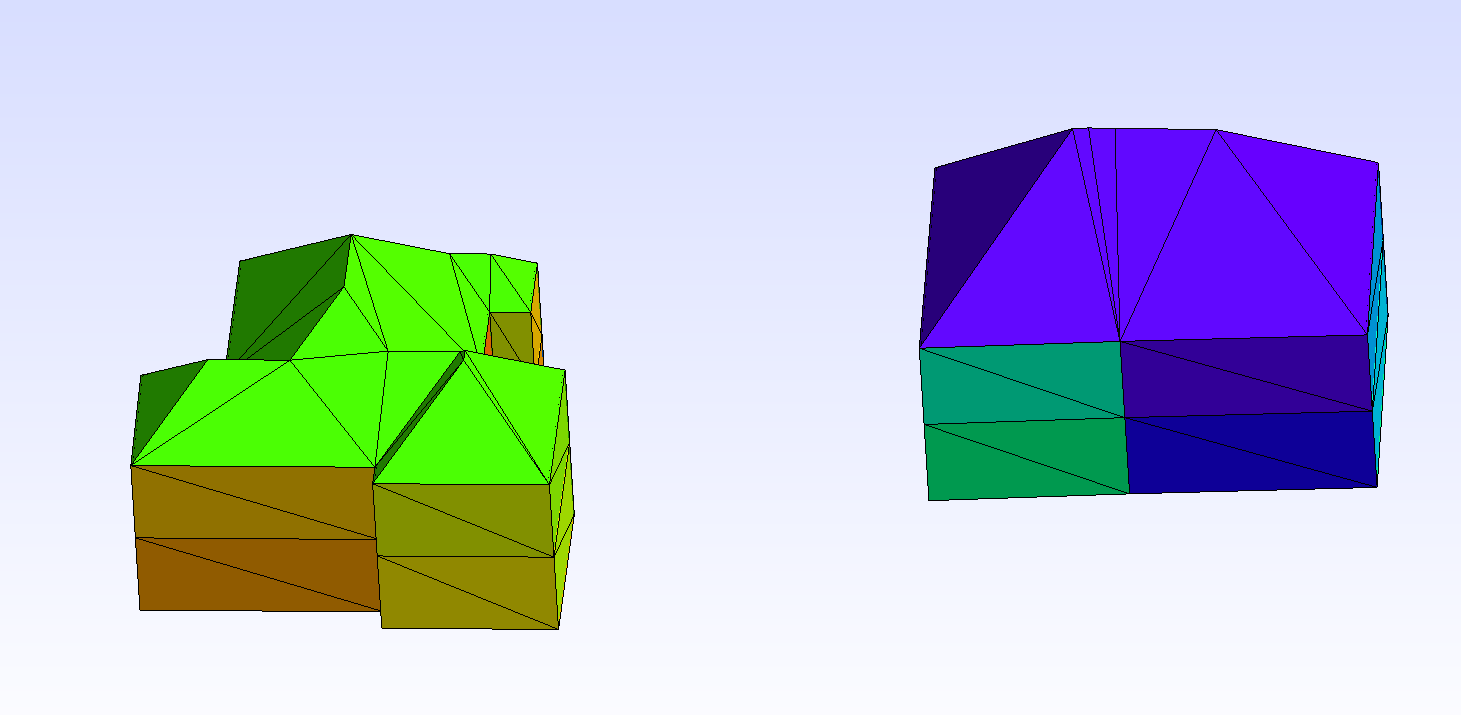
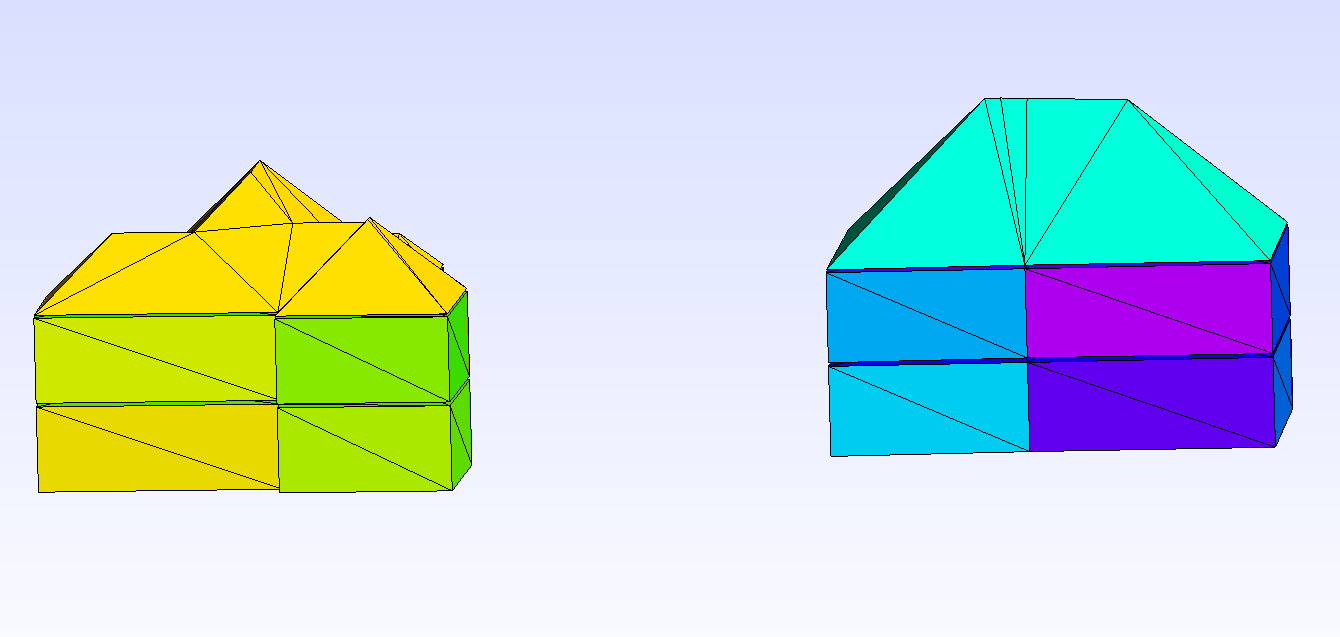
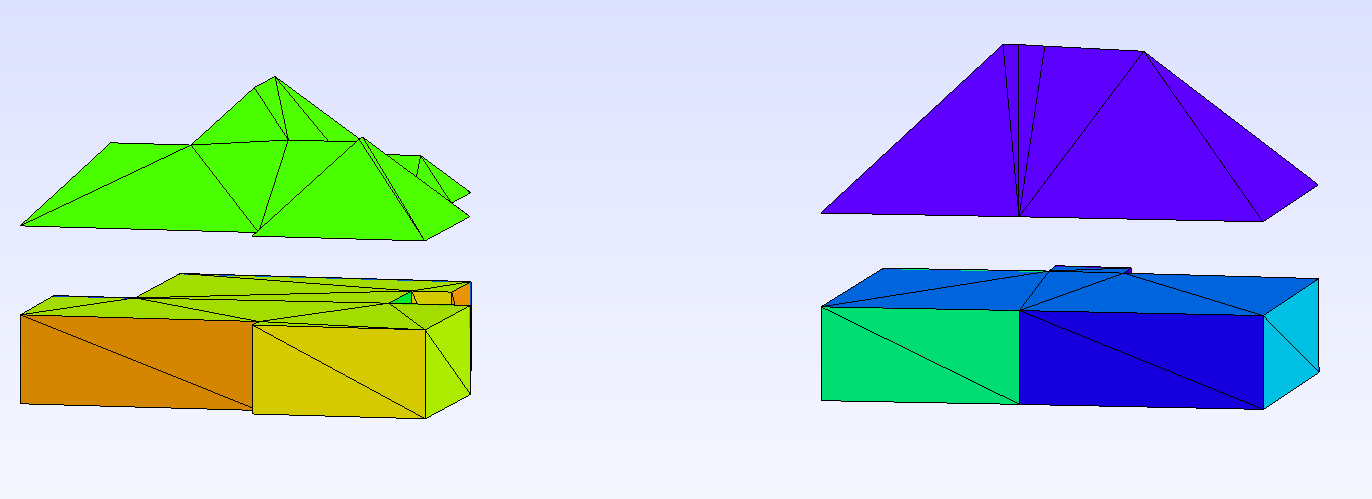
The images provide a detailed view of the marked surface mesh, internal walls, and specific sections like floors and roofs.
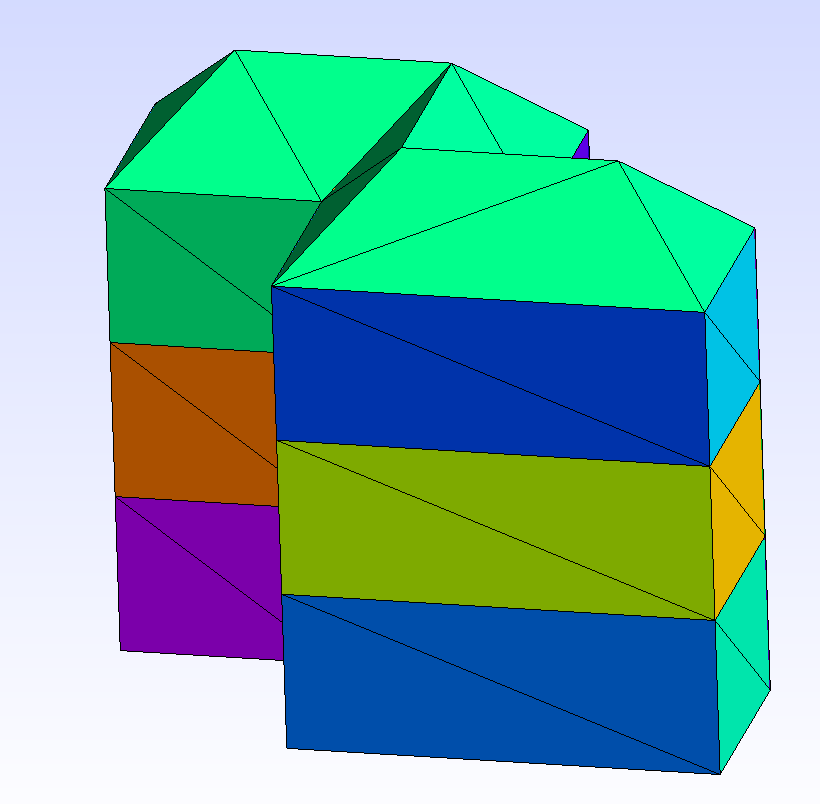
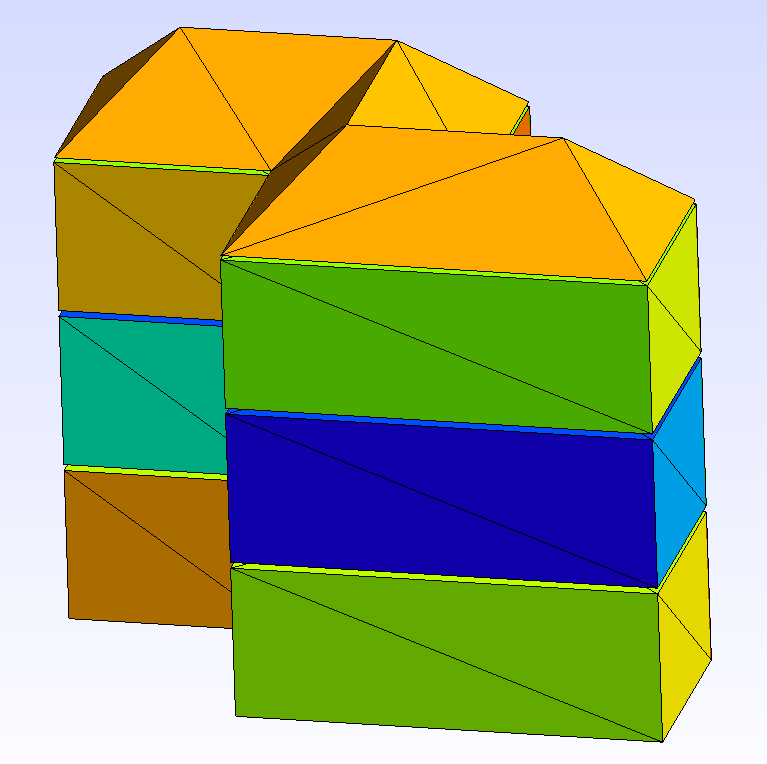
2.2. Volume Mesh
The volume mesh for multiple buildings illustrates the internal structures and spatial distribution across multiple buildings.
|
|
|
Video of the resulting volume mesh |
Volume Mesh of Building 1 |
Volume Mesh of Building 2 |
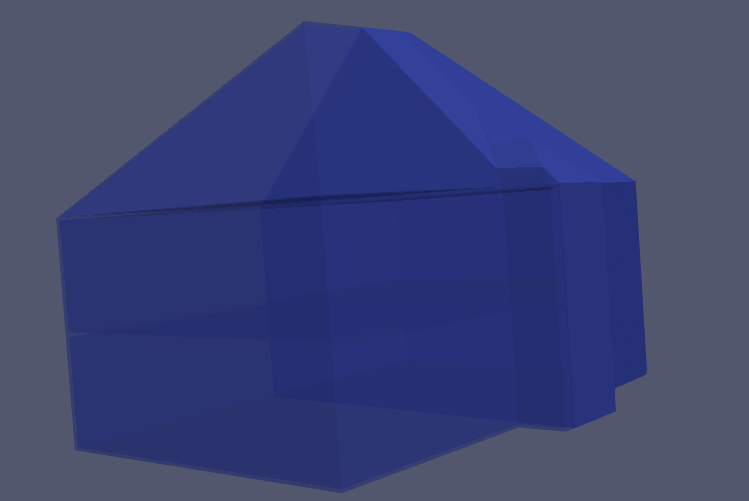
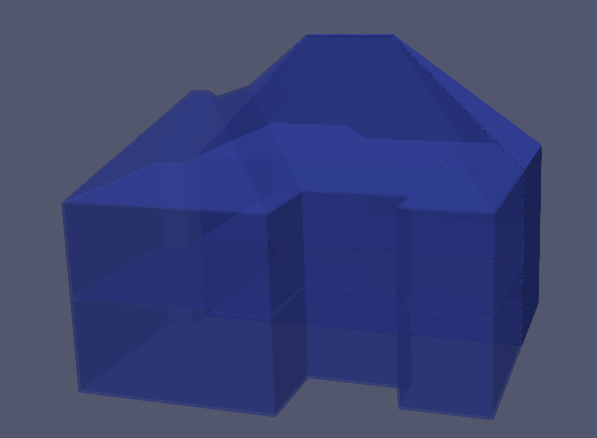
The video and images show the volumetric details of each building, providing a comprehensive view of their internal structures.
3. District
This section covers a district containing over 700 buildings. The data used was provided by Vincent Chabannes.
The gis.json file used previously represents the first two buildings of this dataset.
Analyzing a large number of buildings within a district provides insights into urban planning and large-scale structural interactions.
3.1. Surface Mesh
In this section, the result is obtained using the following command:
./src/applications/ktirio_geom_app_building_lod1 --i ../../data/buildinglod1/gisB.json --r
|
|
|
District with Roof |
District without Roof |
District with Union and Roof |
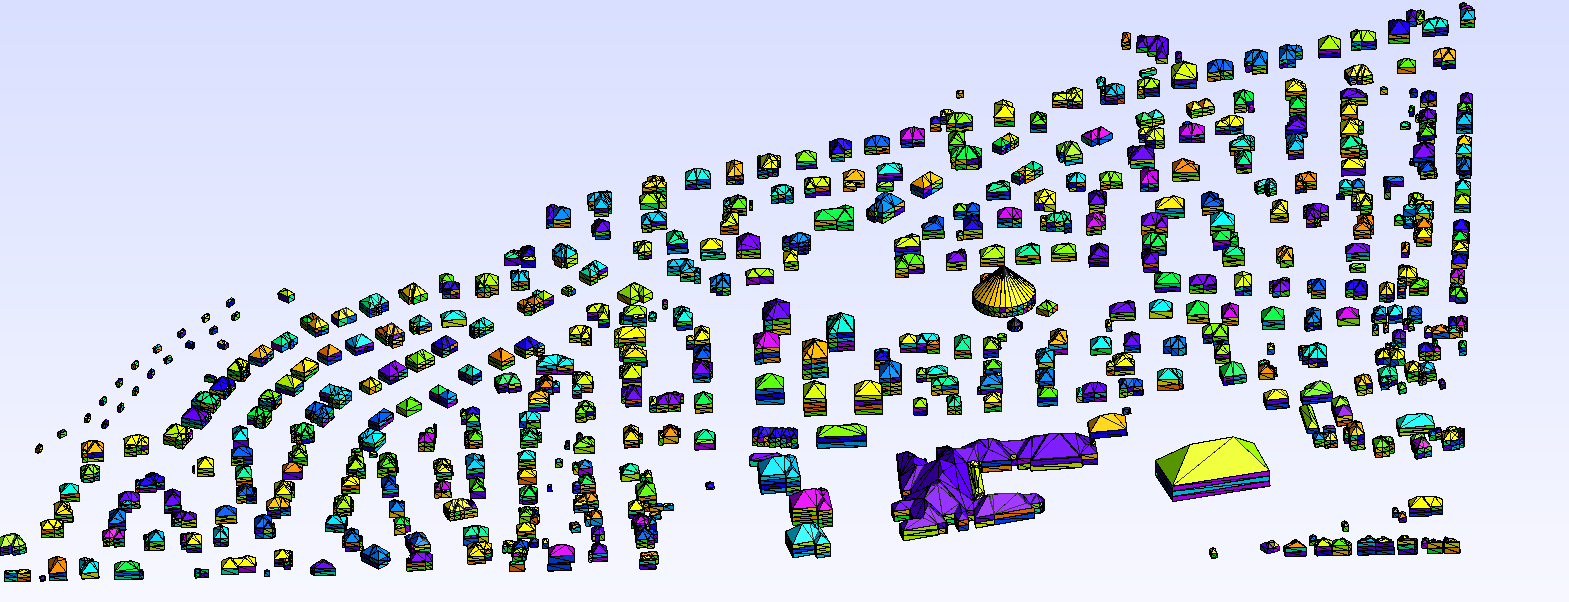
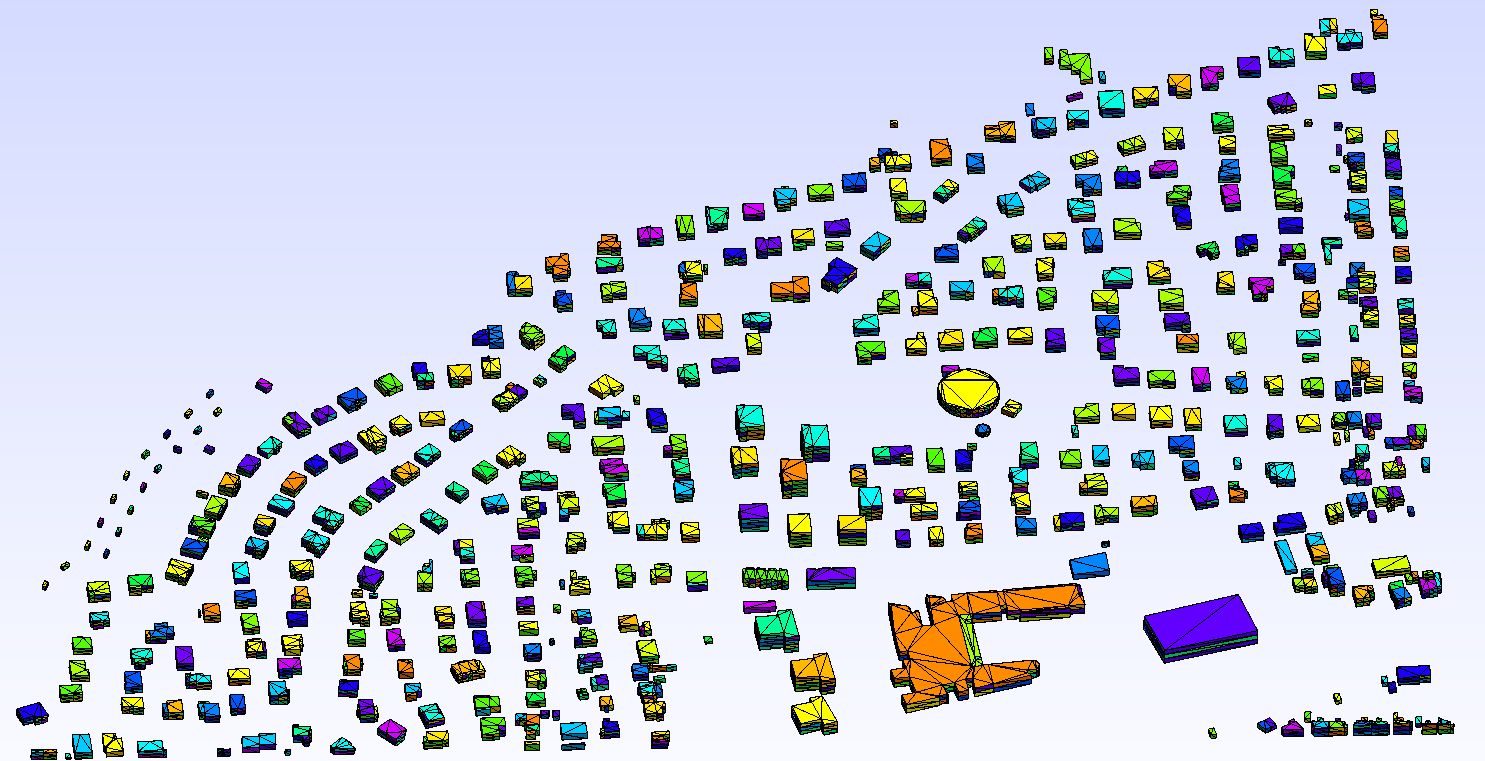
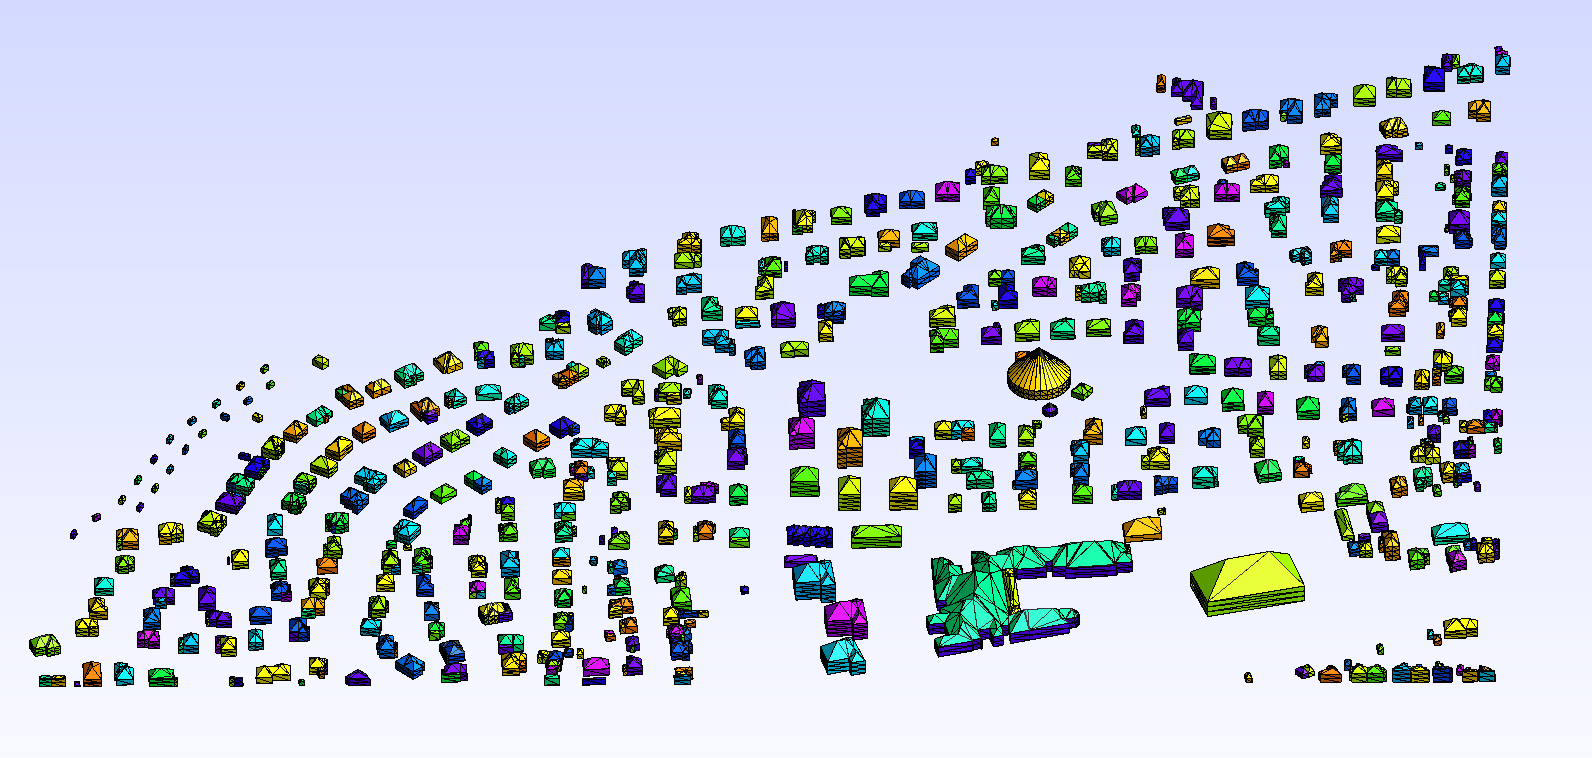
Important Note: One building was ignored because its height value was 0. For the school (the largest building), the union between the roof and base was changed to a merge due to errors (automatic adjustment).
3.2. Volume Mesh
For the Volume Mesh the data was limited to 25 at maximum to assure result
In this section, the result is obtained using the following command:
./src/applications/ktirio_geom_app_building_lod1 --i ../../data/buildinglod1/gisB.json --r --volume
|
|
|
Volume Mesh of 5 Buildings |
Volume Mesh of 10 Buildings |
Volume Mesh of 25 Buildings |
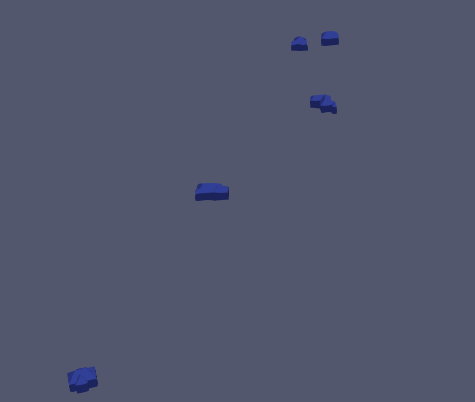
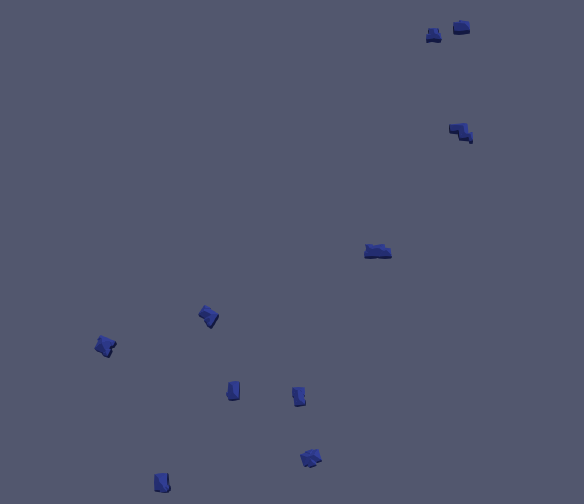
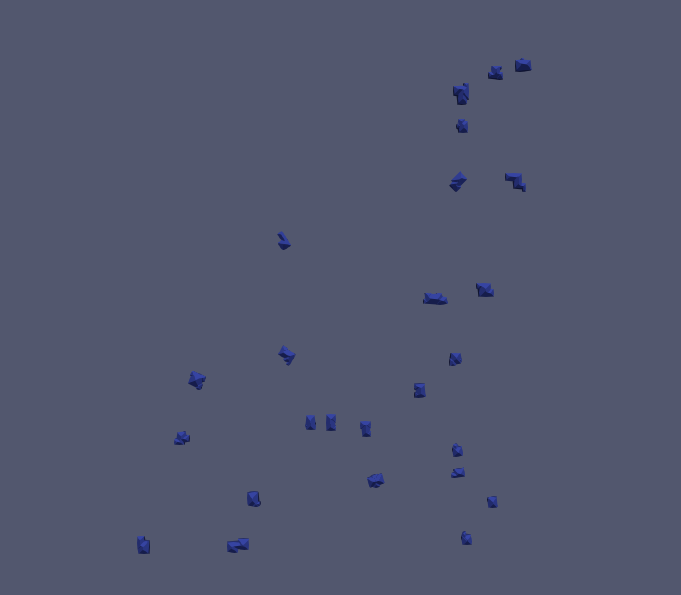
The images display the volume mesh results for different subsets of buildings. In these cases, the resulting files start to become large. For example, the volume mesh for 10 buildings is 1.7 GB, and for 25 buildings, it is 3.7 GB. This highlights the computational challenges and data management considerations when dealing with large datasets.