 .pdf
.pdf
Exporting and visualization
After completing the triangulation and mesh refinement process, the resulting meshes are exported and visualized to evaluate the accuracy and quality of the generated terrain models. This section presents the visualizations of the final meshes, which were created using both lambda functions and GPS data.
The meshes were exported in the MSH format, which is compatible with Gmsh, a popular open-source finite element mesh generator with a built-in CAD engine and post-processor, making it ideal for visualizing and assessing the quality of the generated meshes. The following images illustrate the mesh structures after the application of contour constraints and re-triangulation.
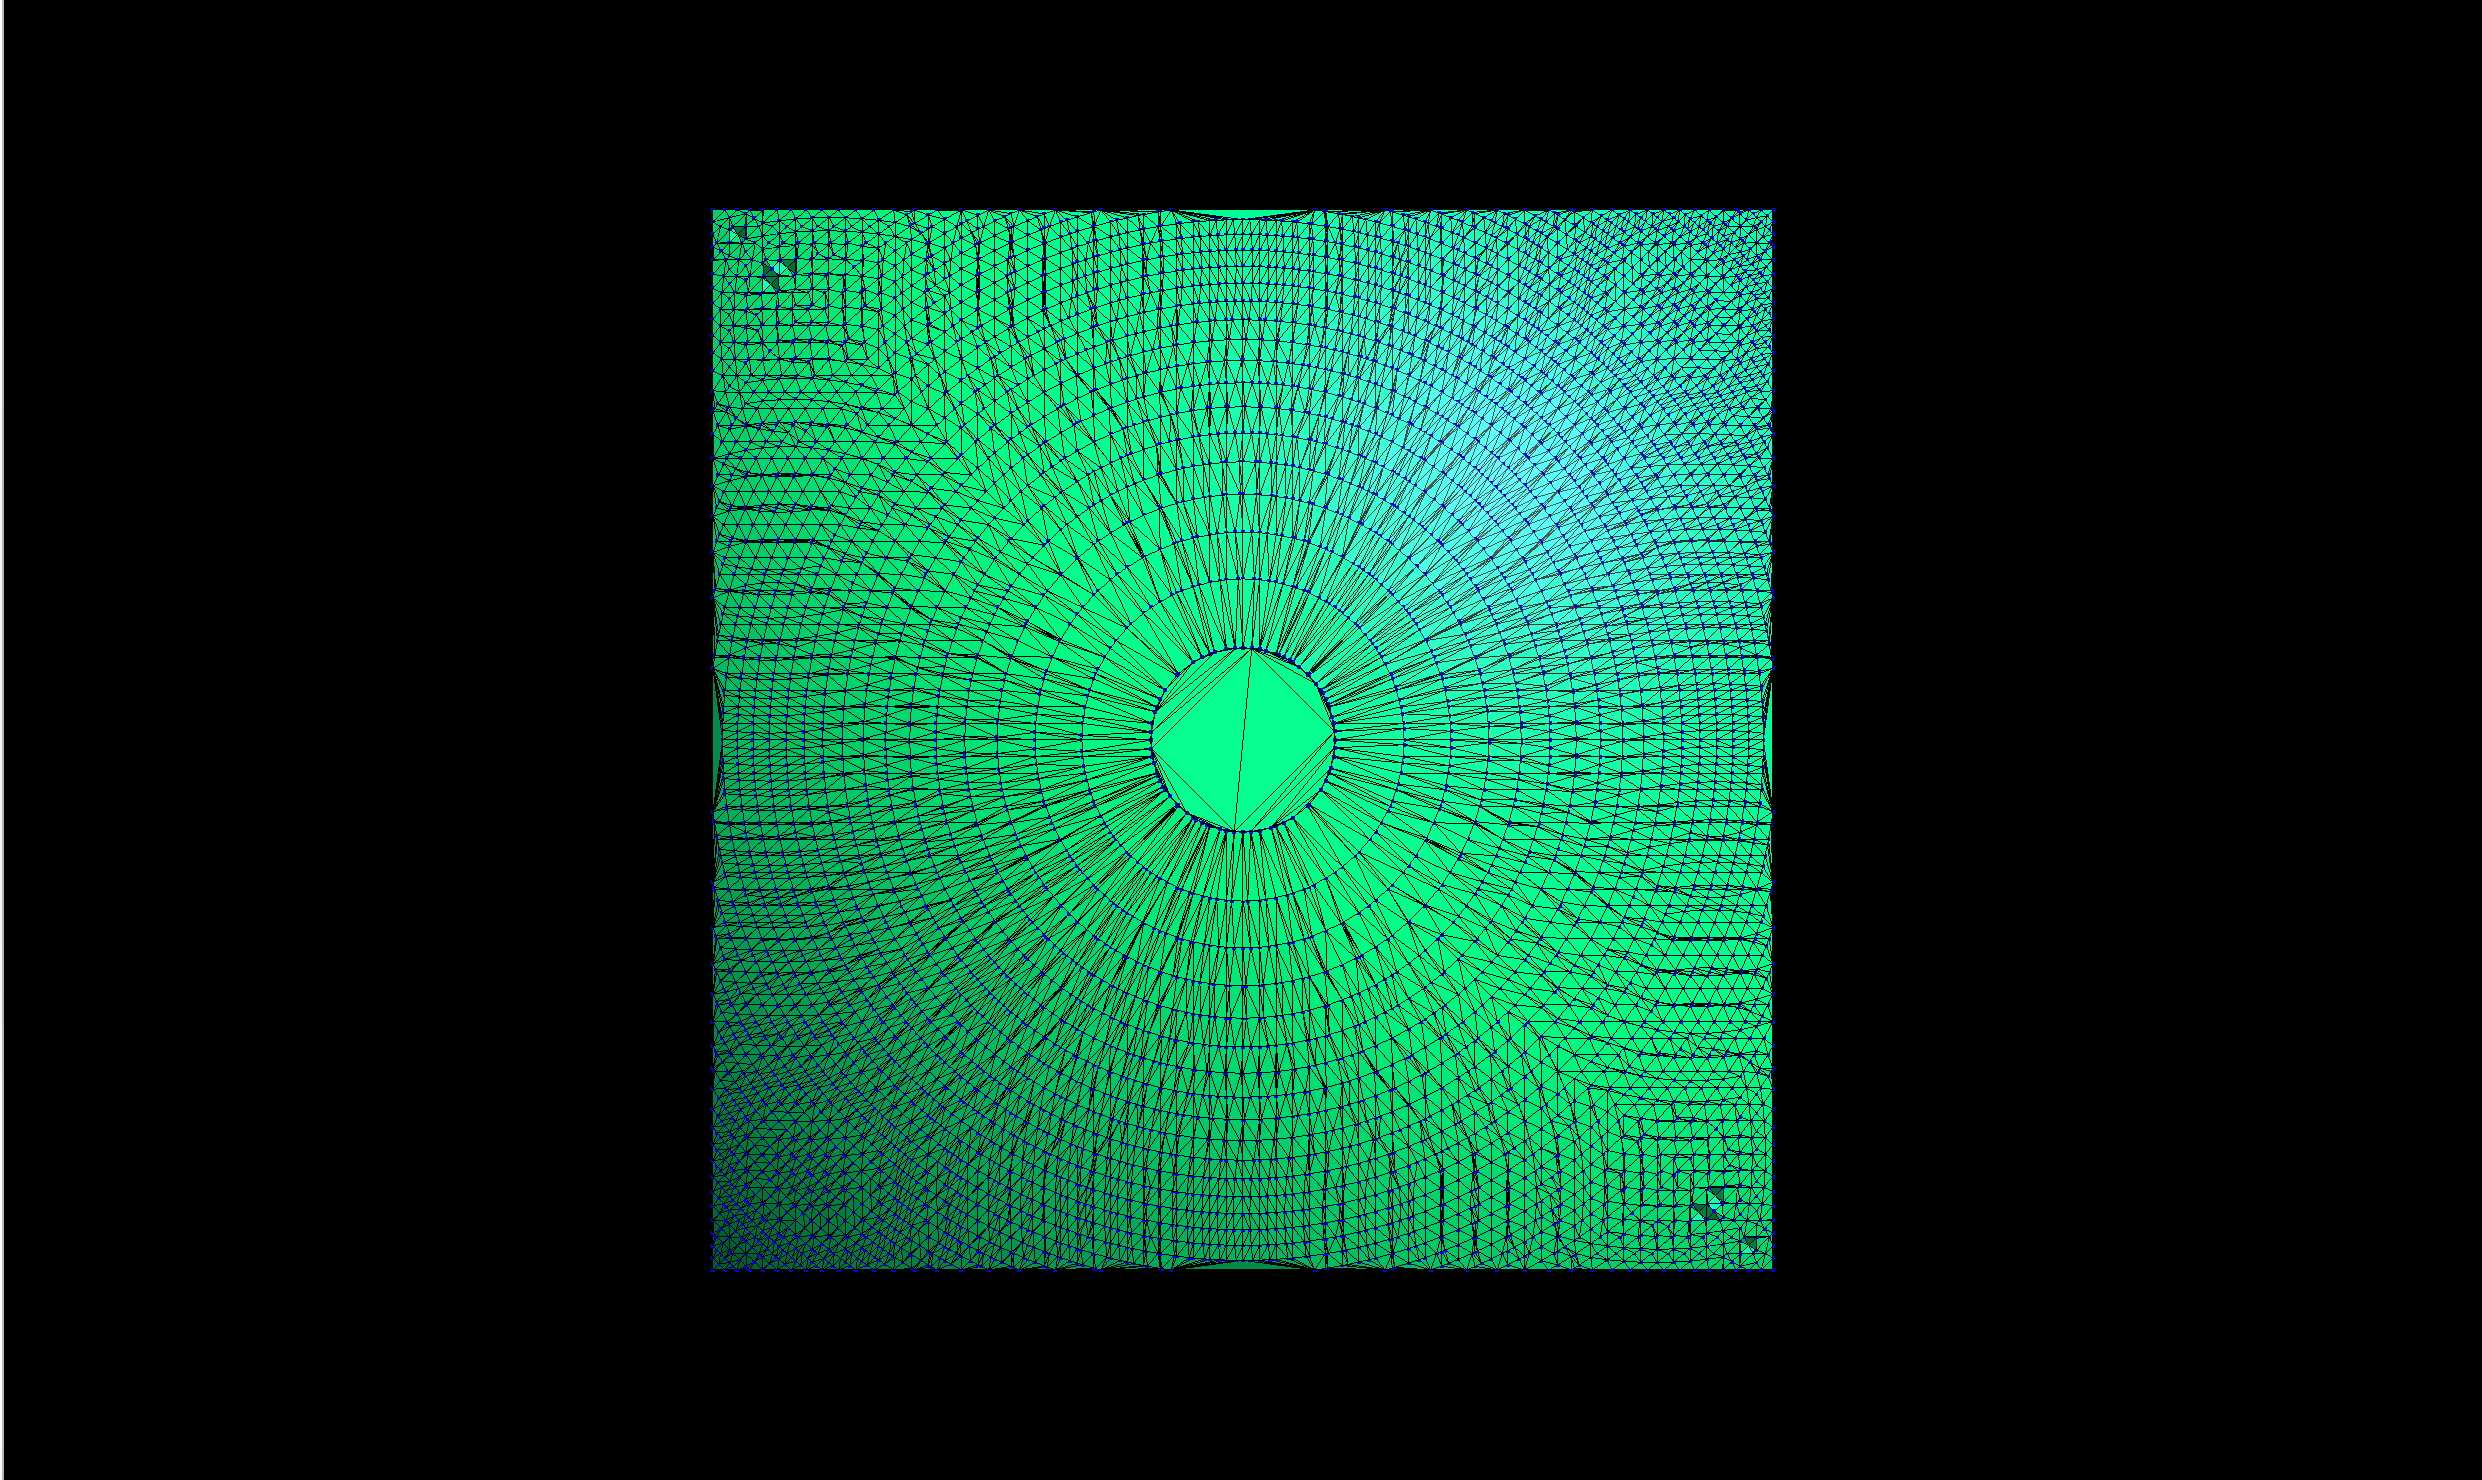
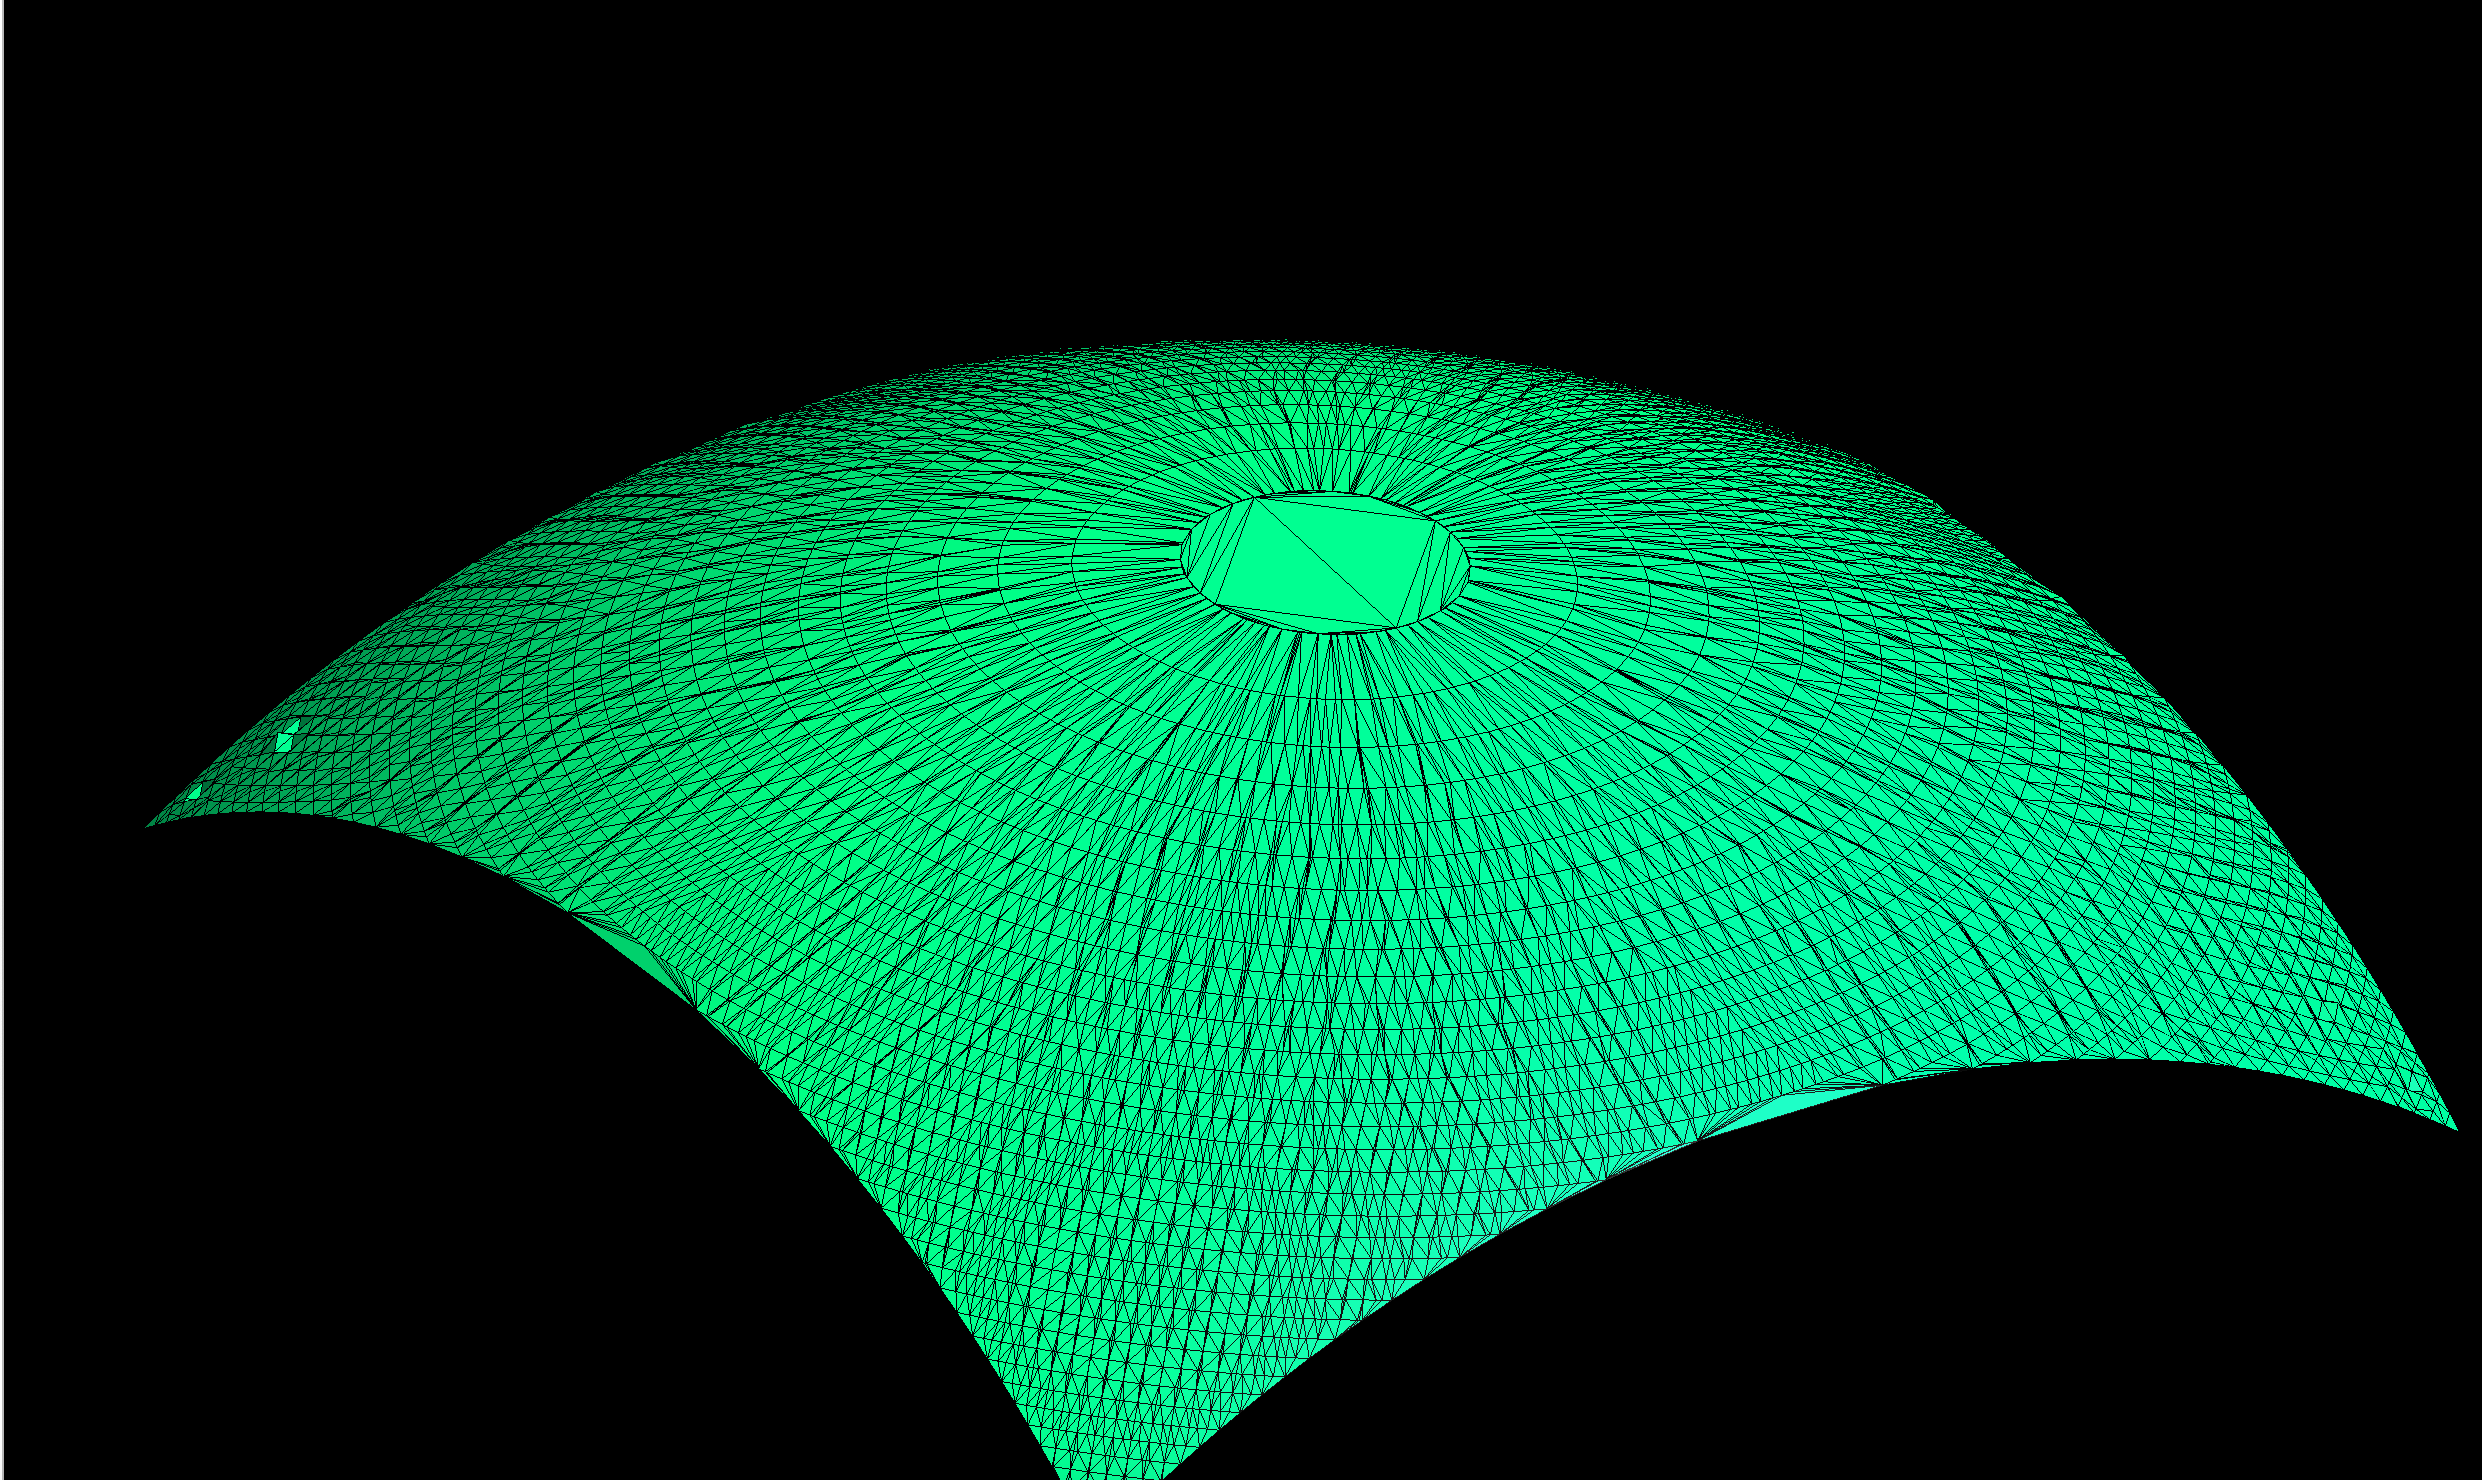
1. First lambda function
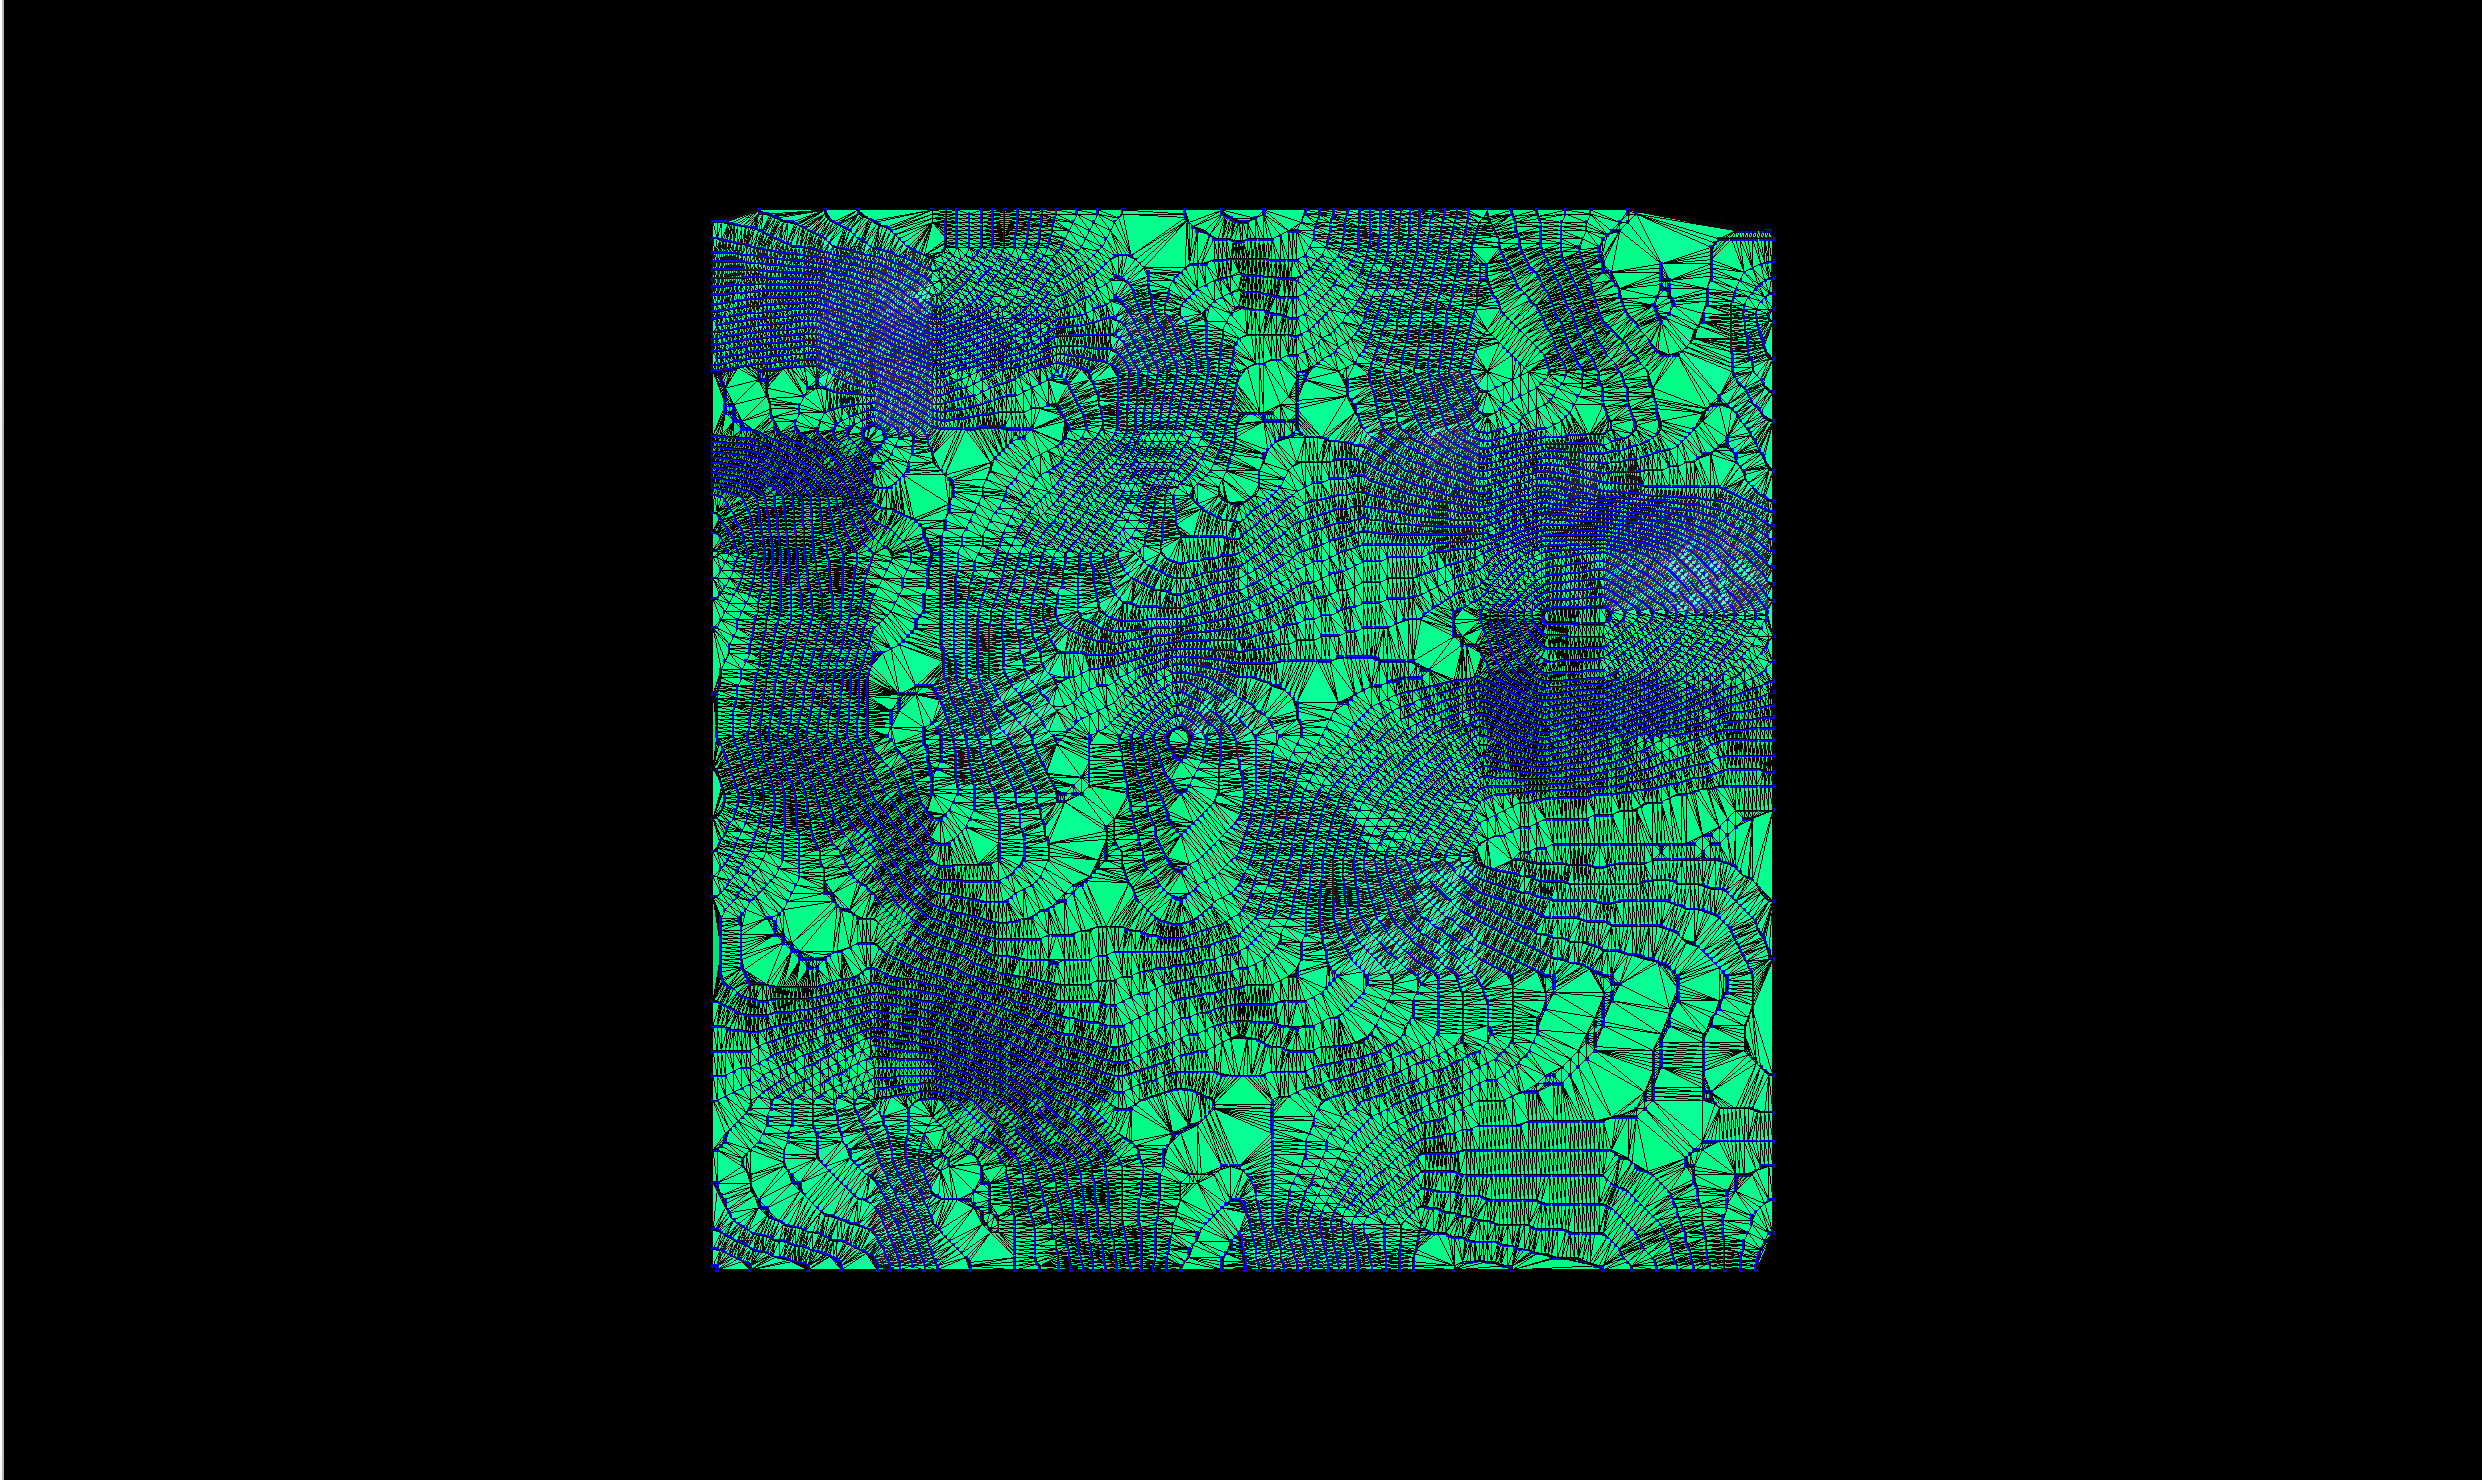
The first set of images shows the mesh generated using \(z(x, y) = \sqrt{r^2 - (x - x_0)^2 - (y - y_0)^2}\) which produces a half-sphere:
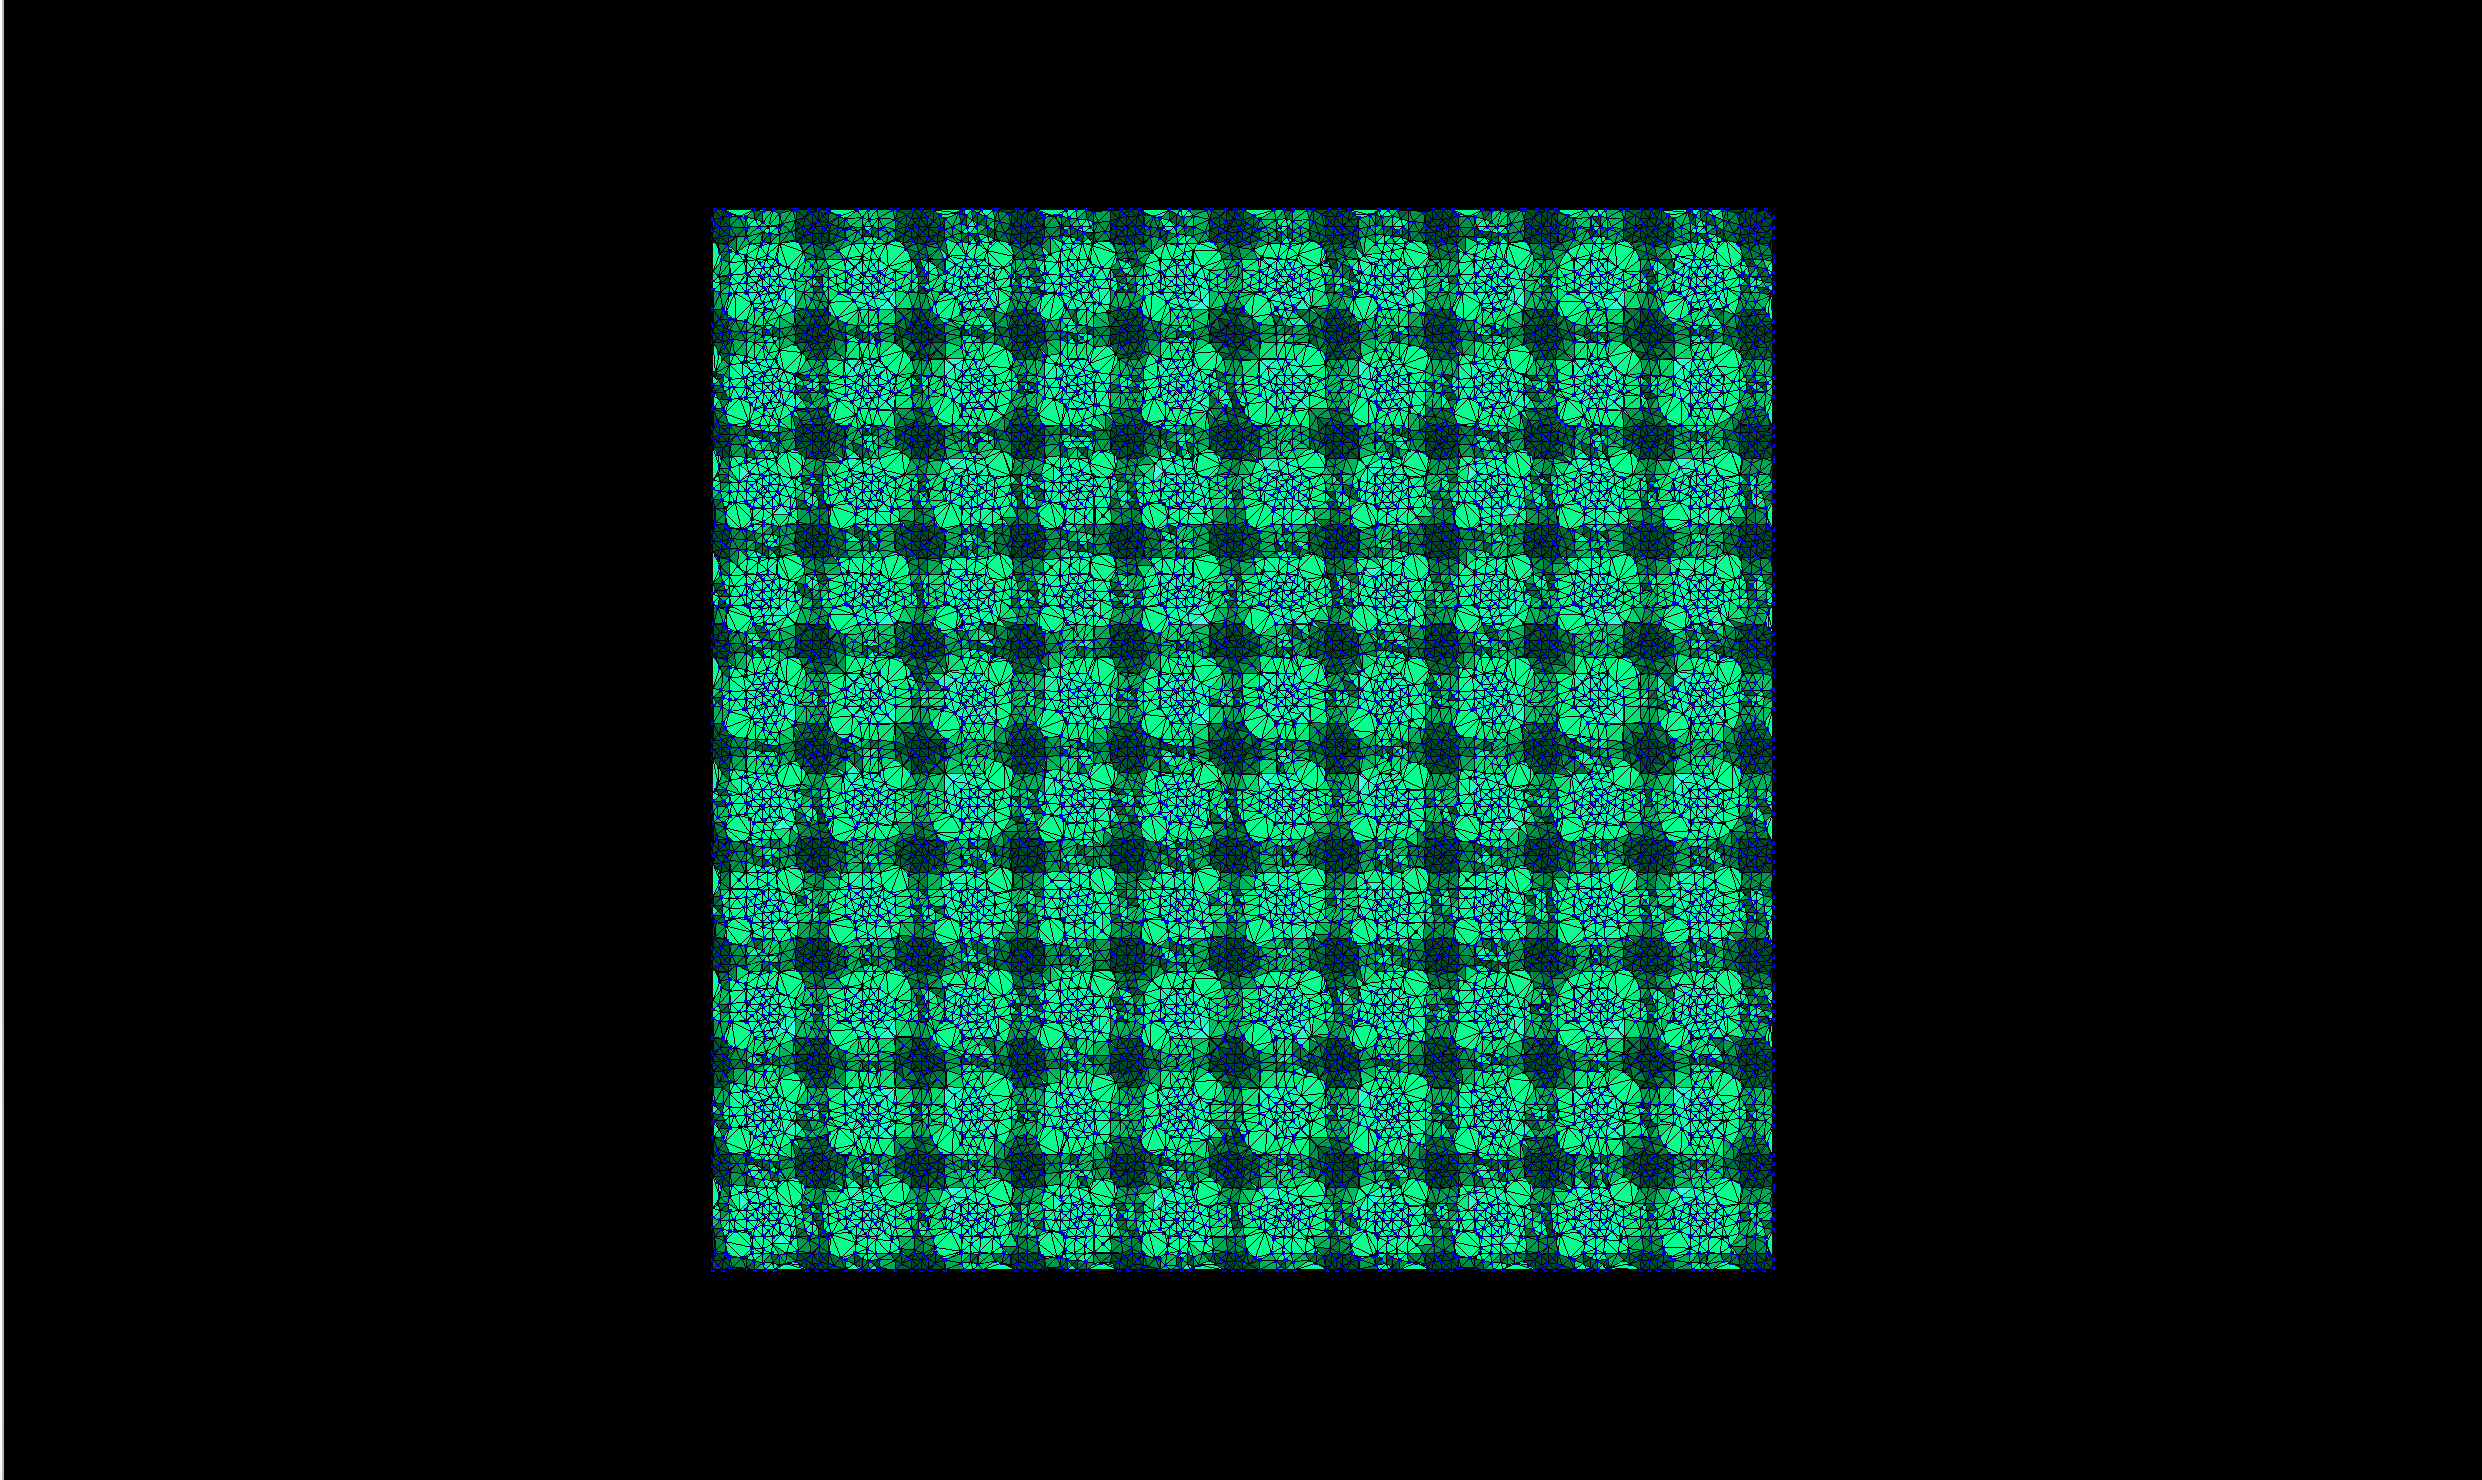
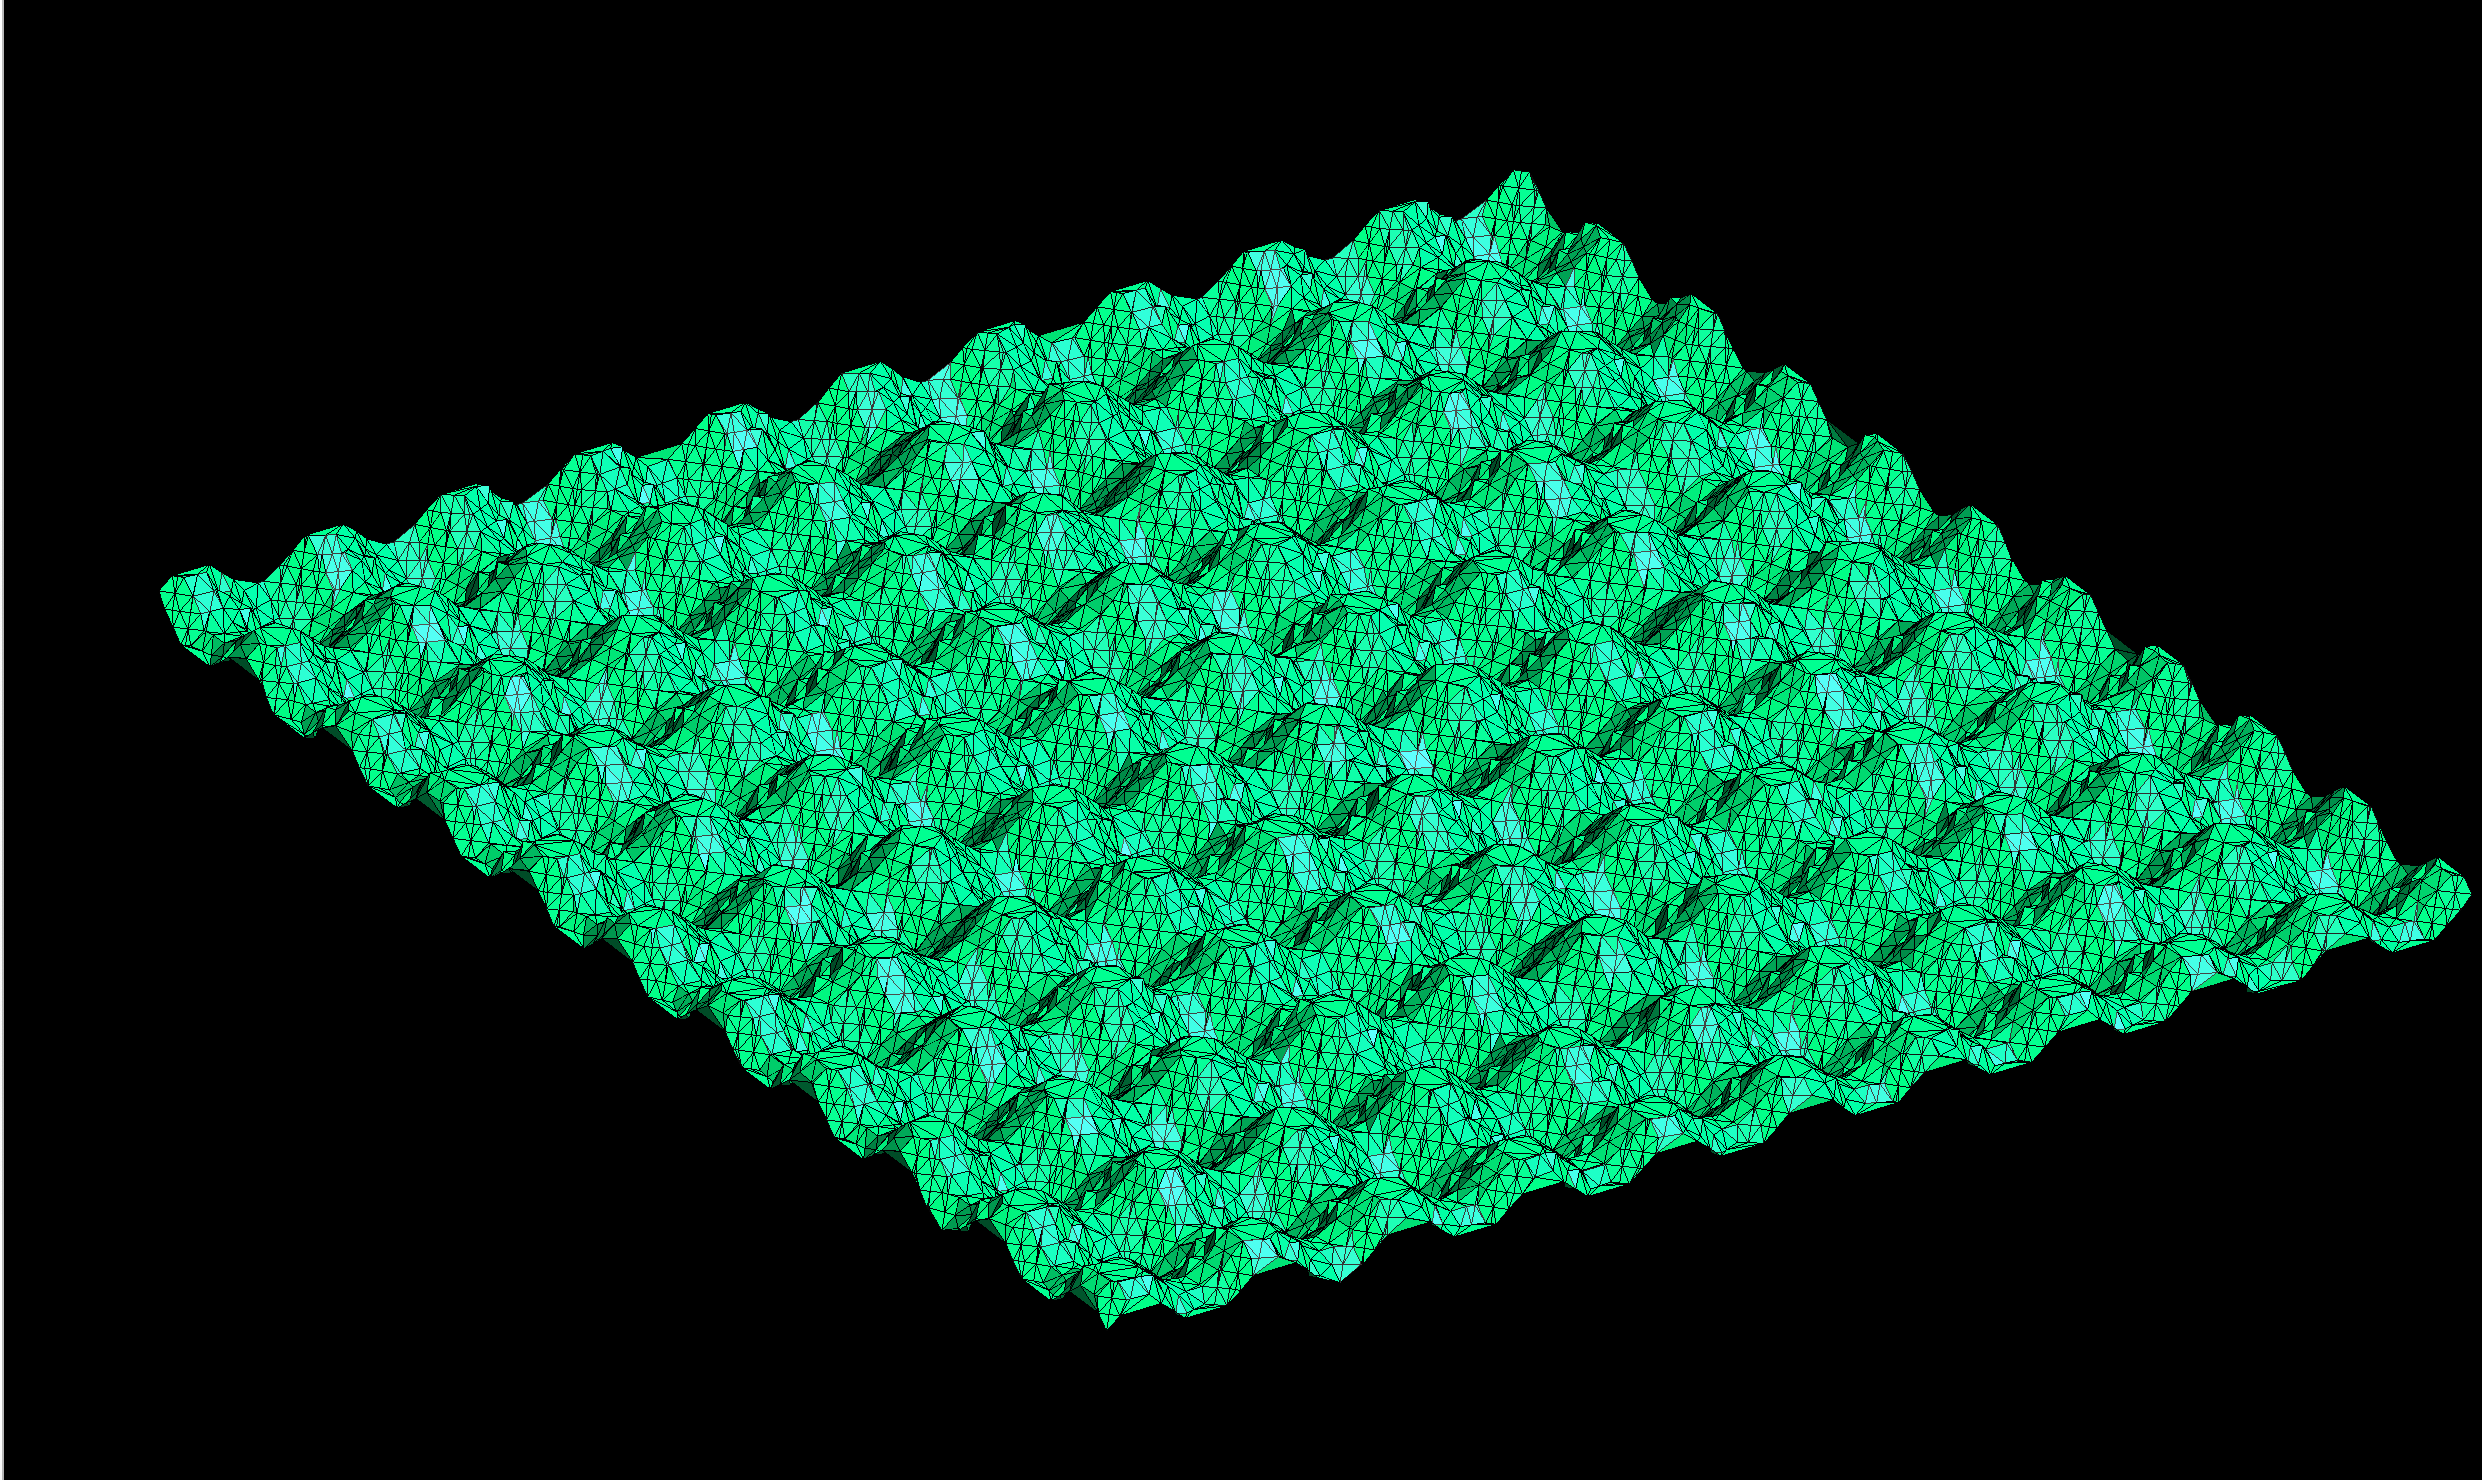
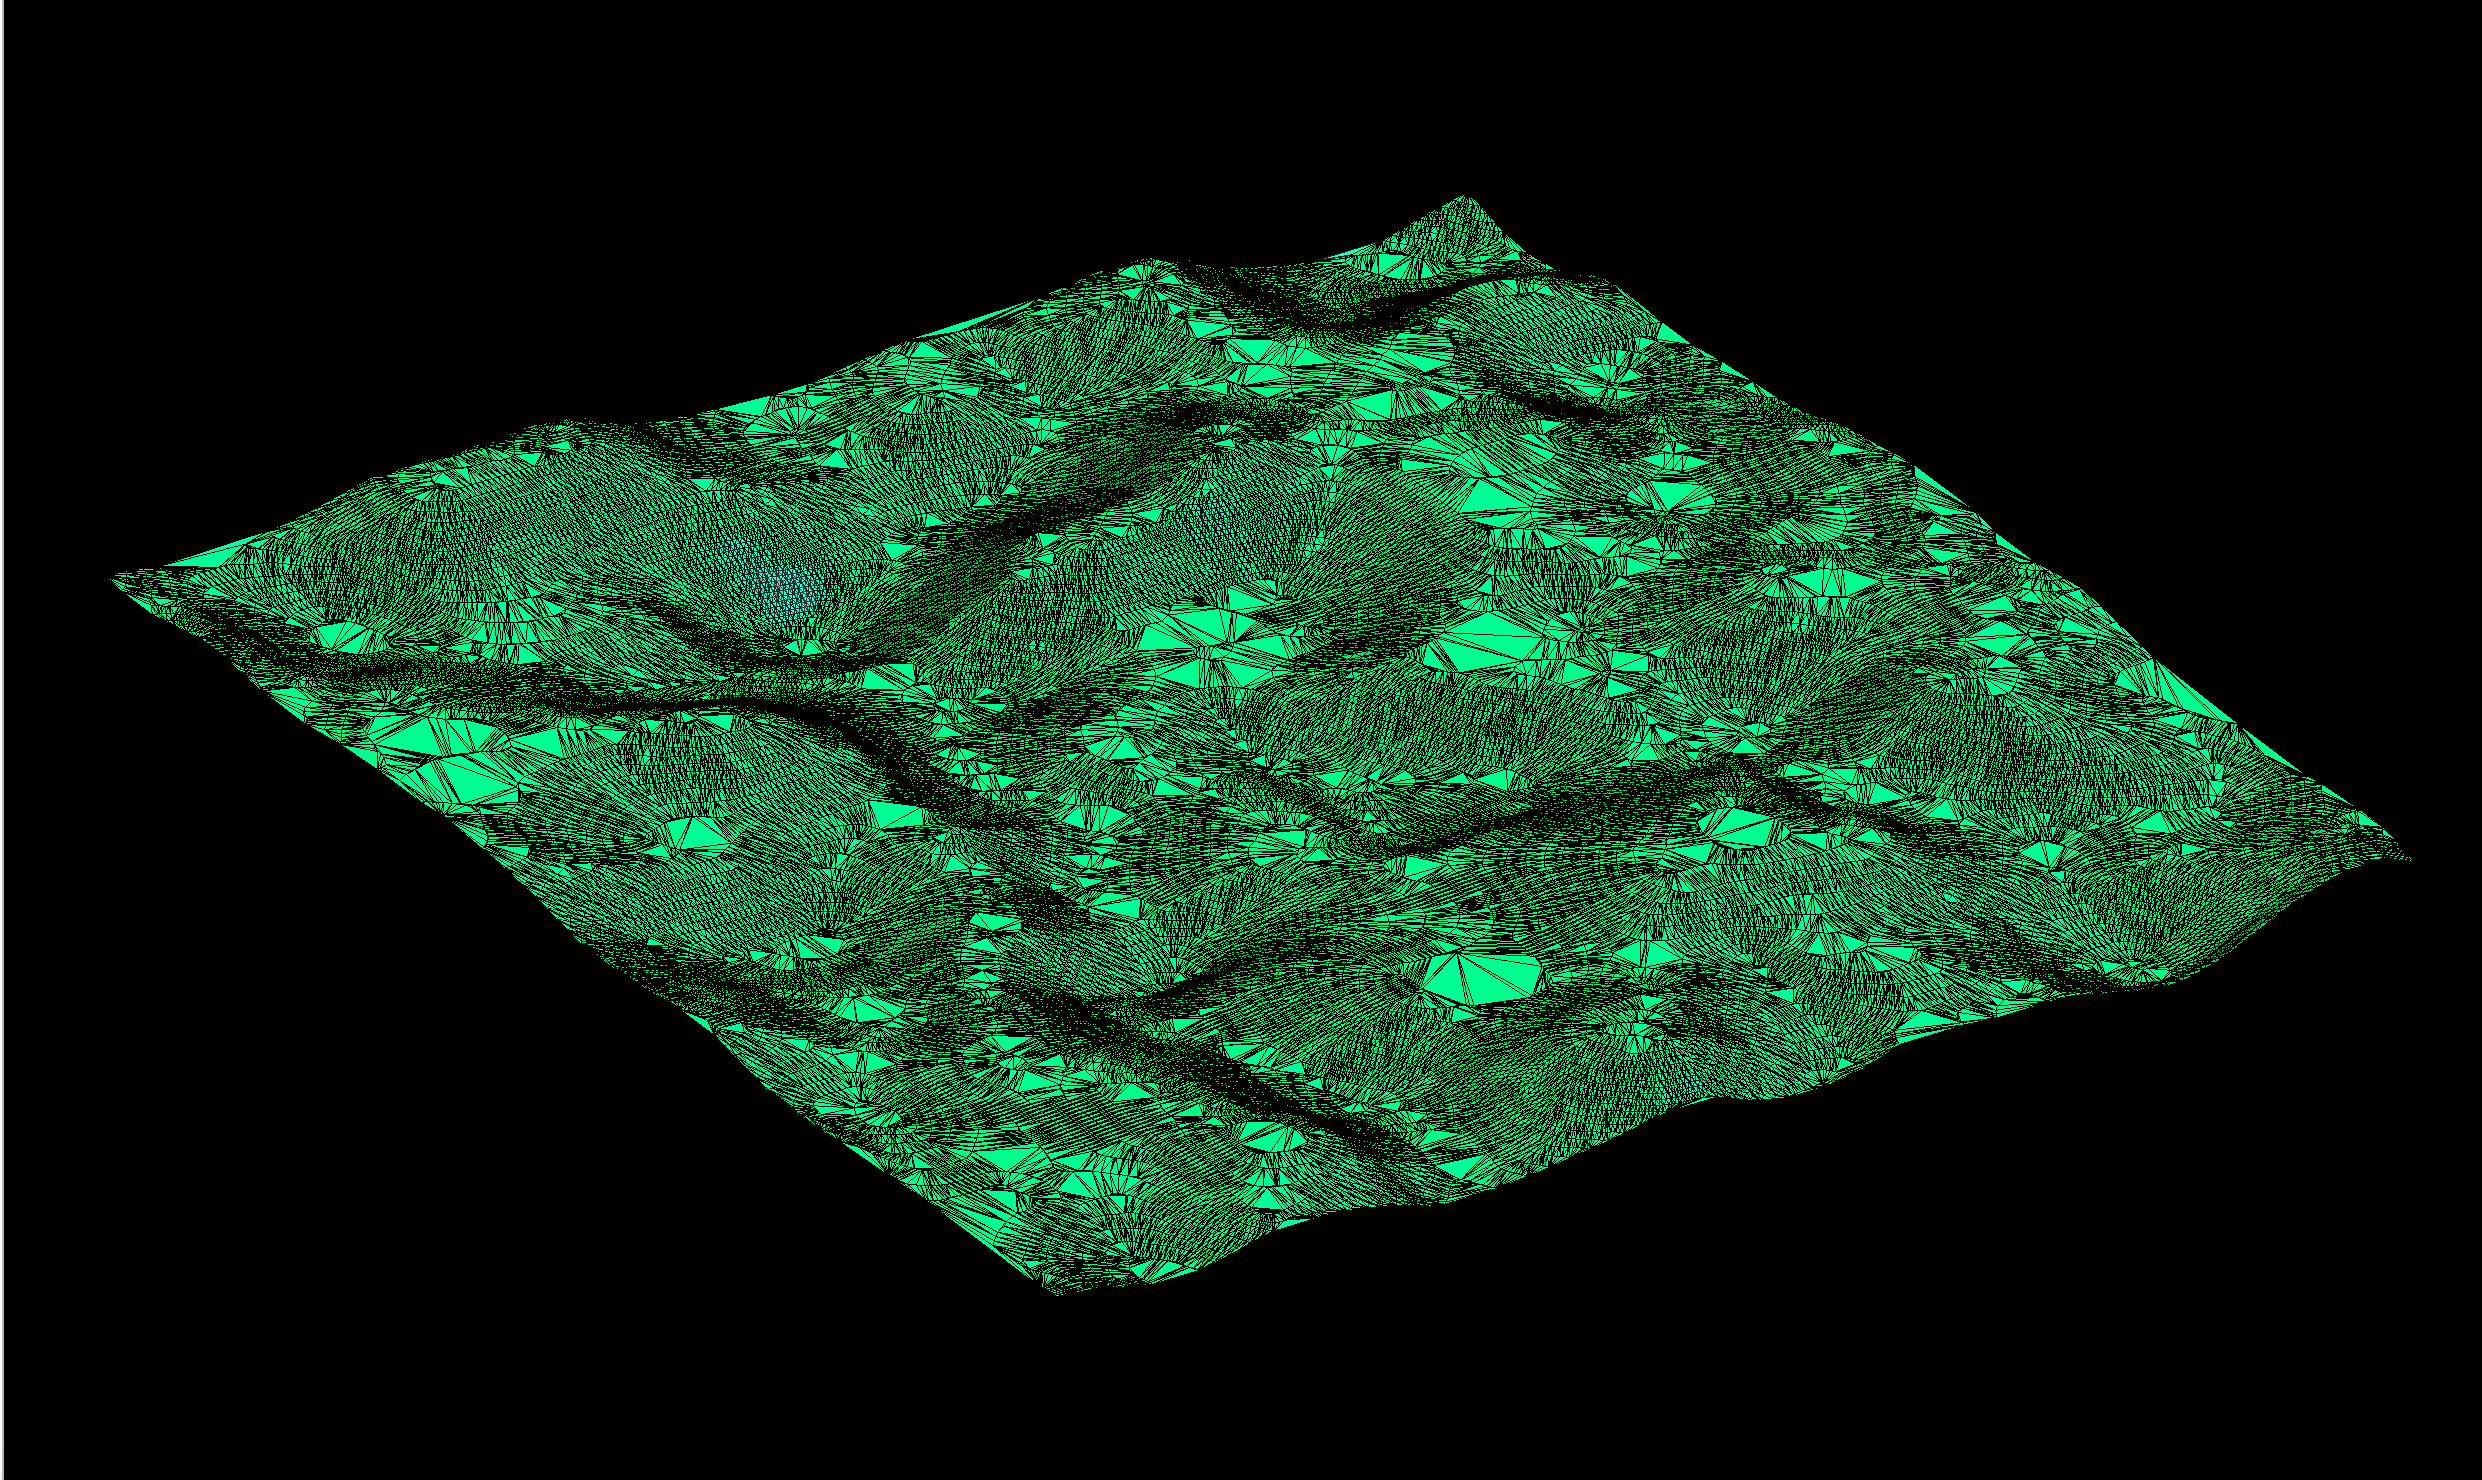
2. Second lambda function
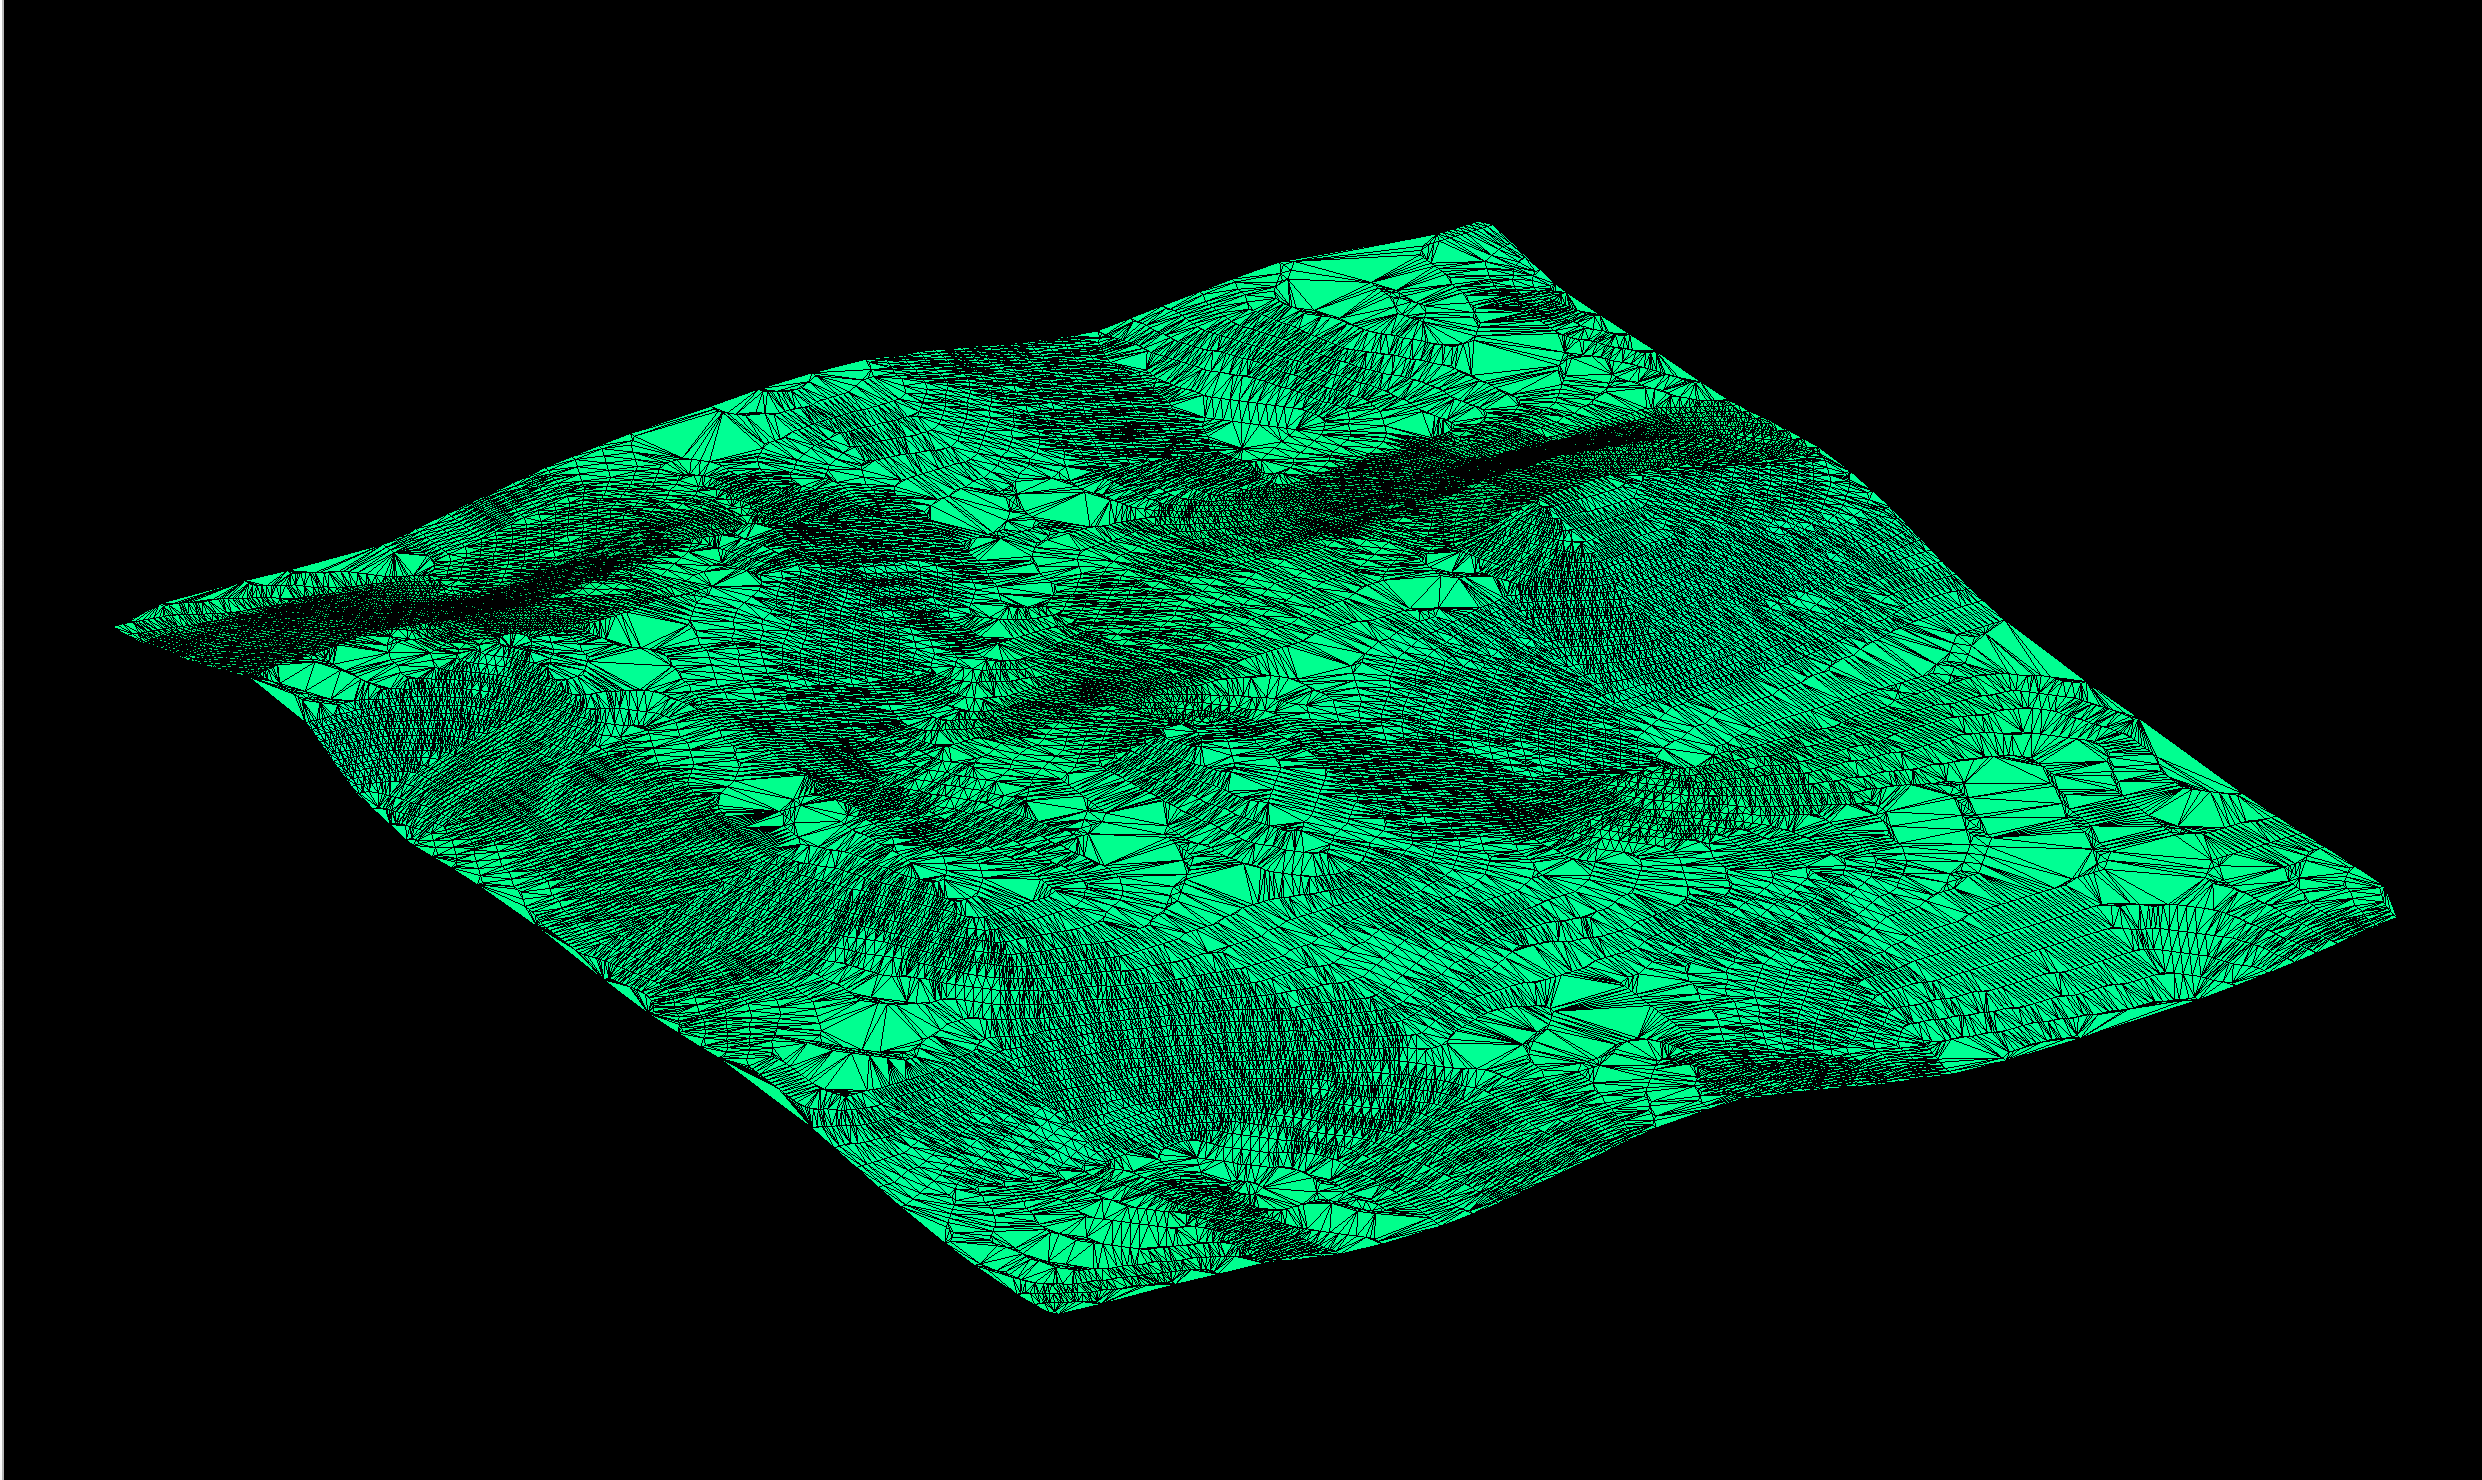
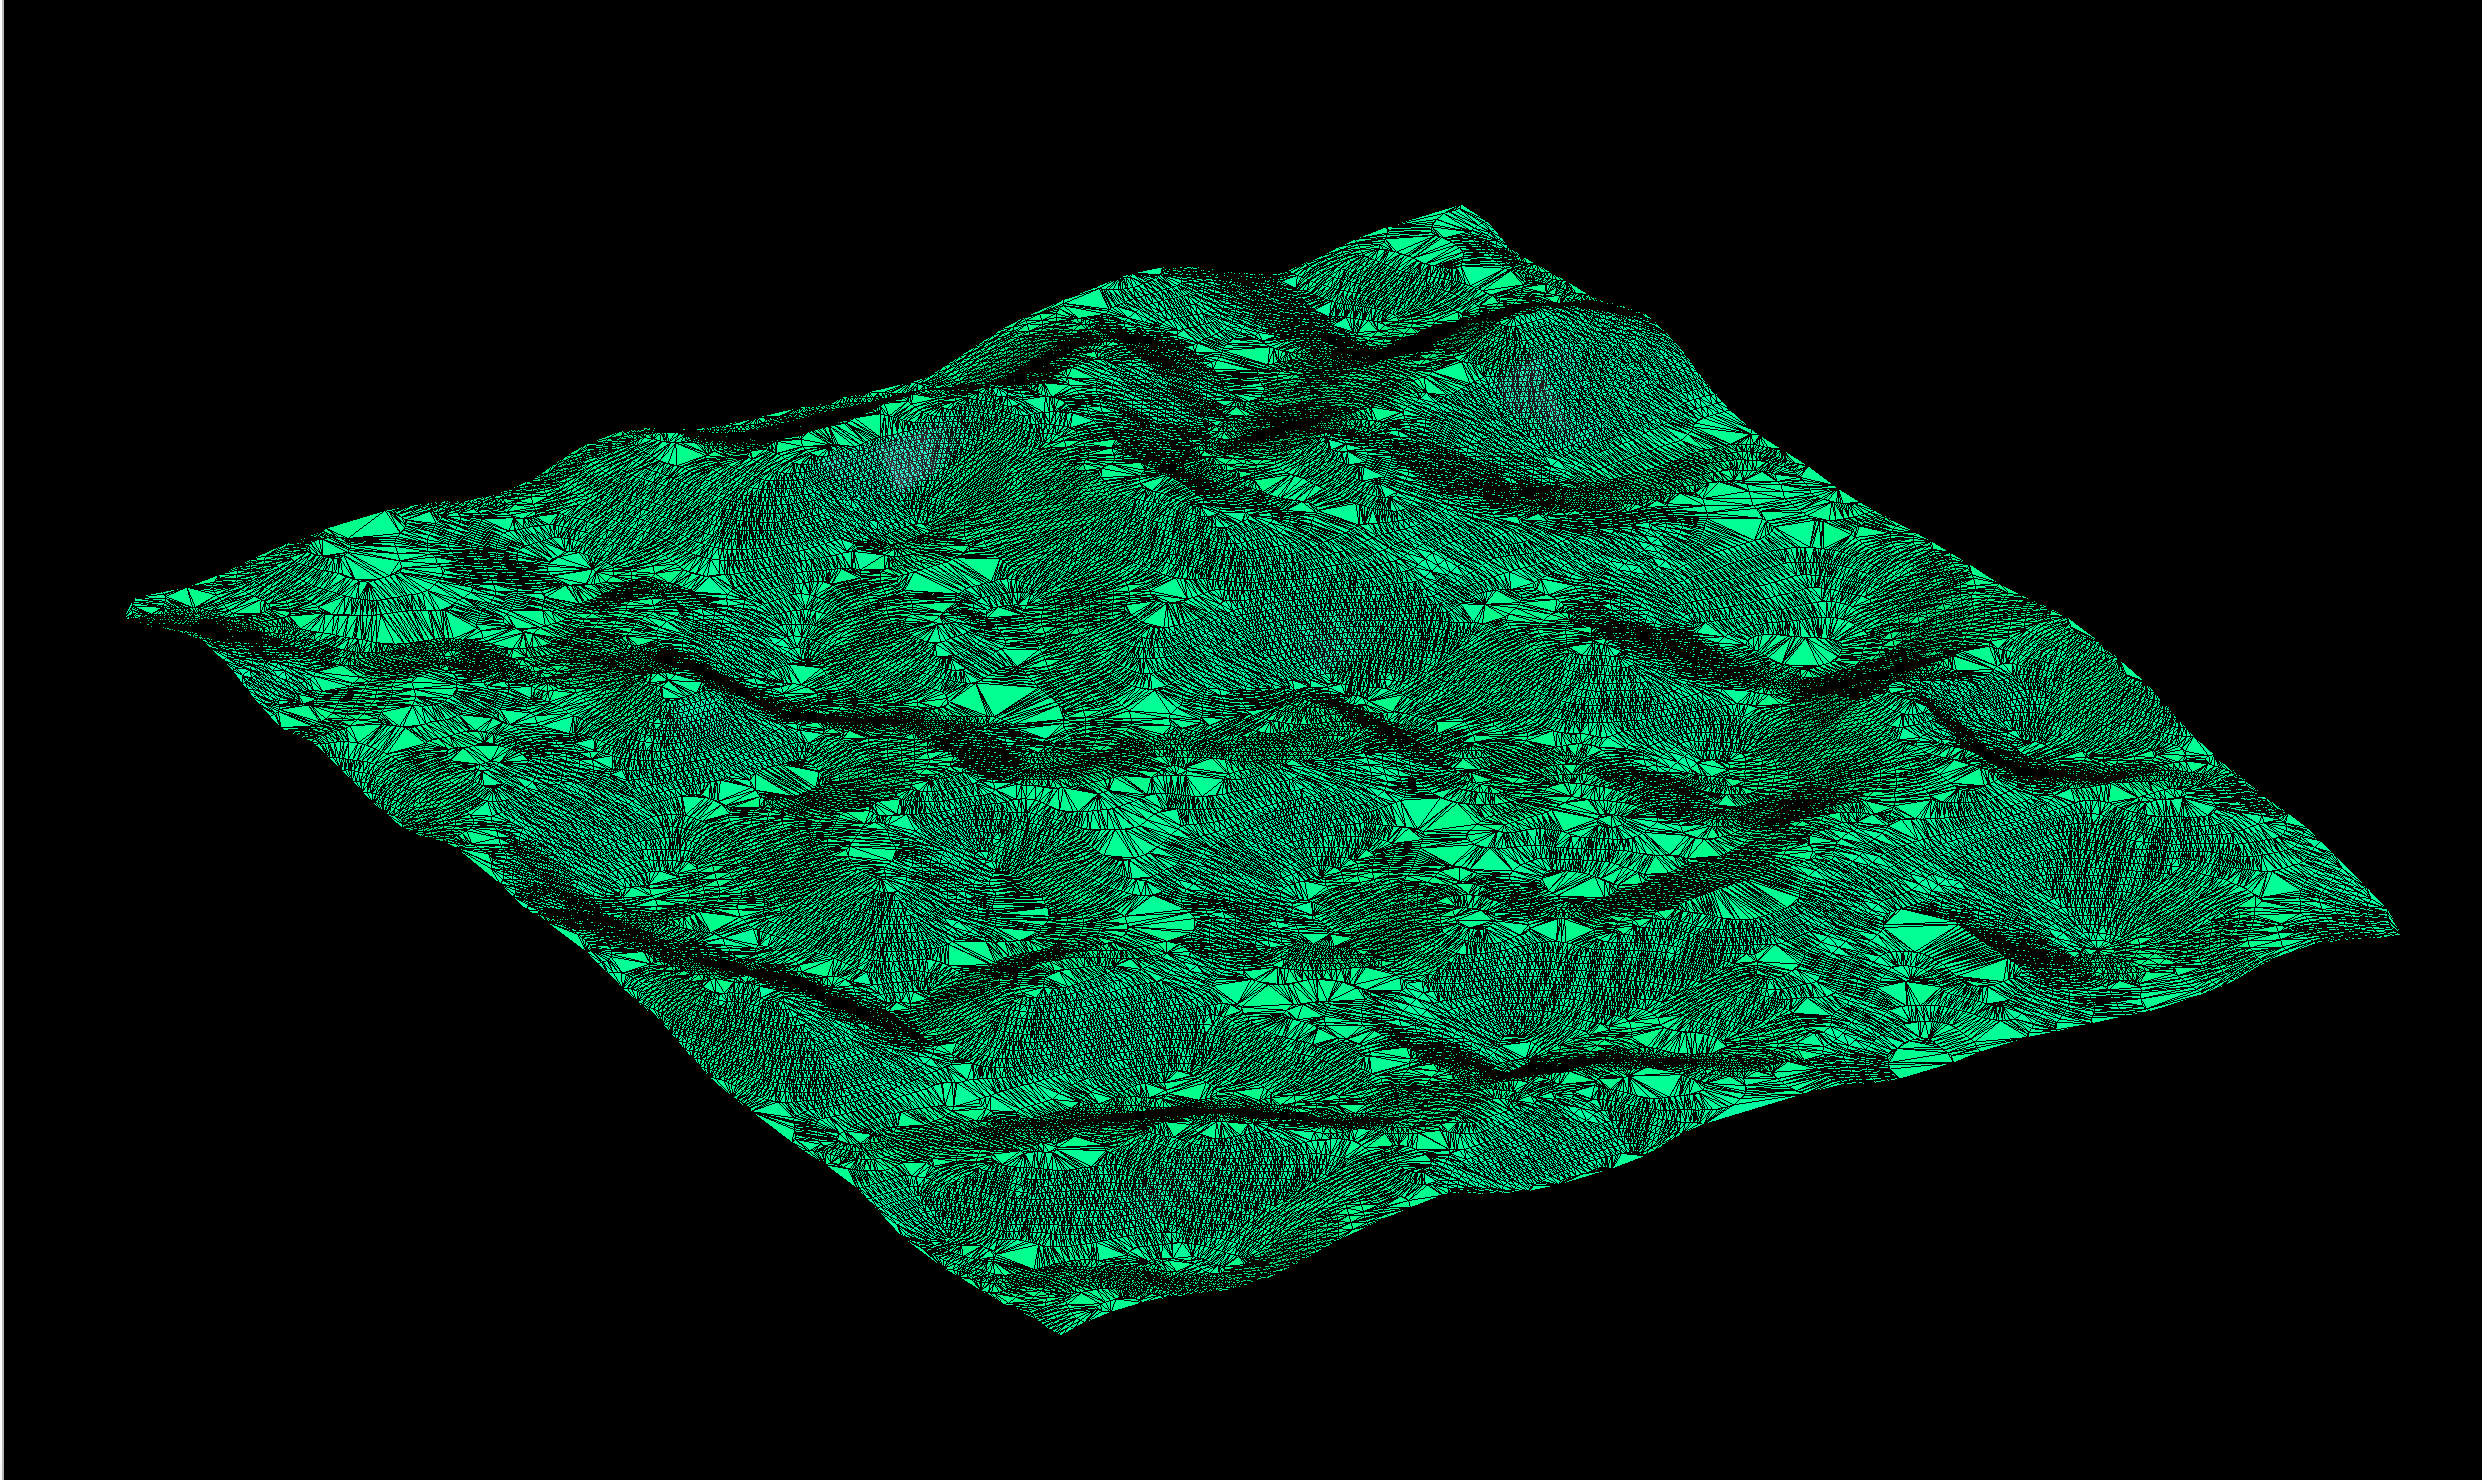
The next set of images depicts the mesh generated using \(z(x, y) = sin(x) + cos(y)\), which creates a wave-like terrain surface:
3. GPS data
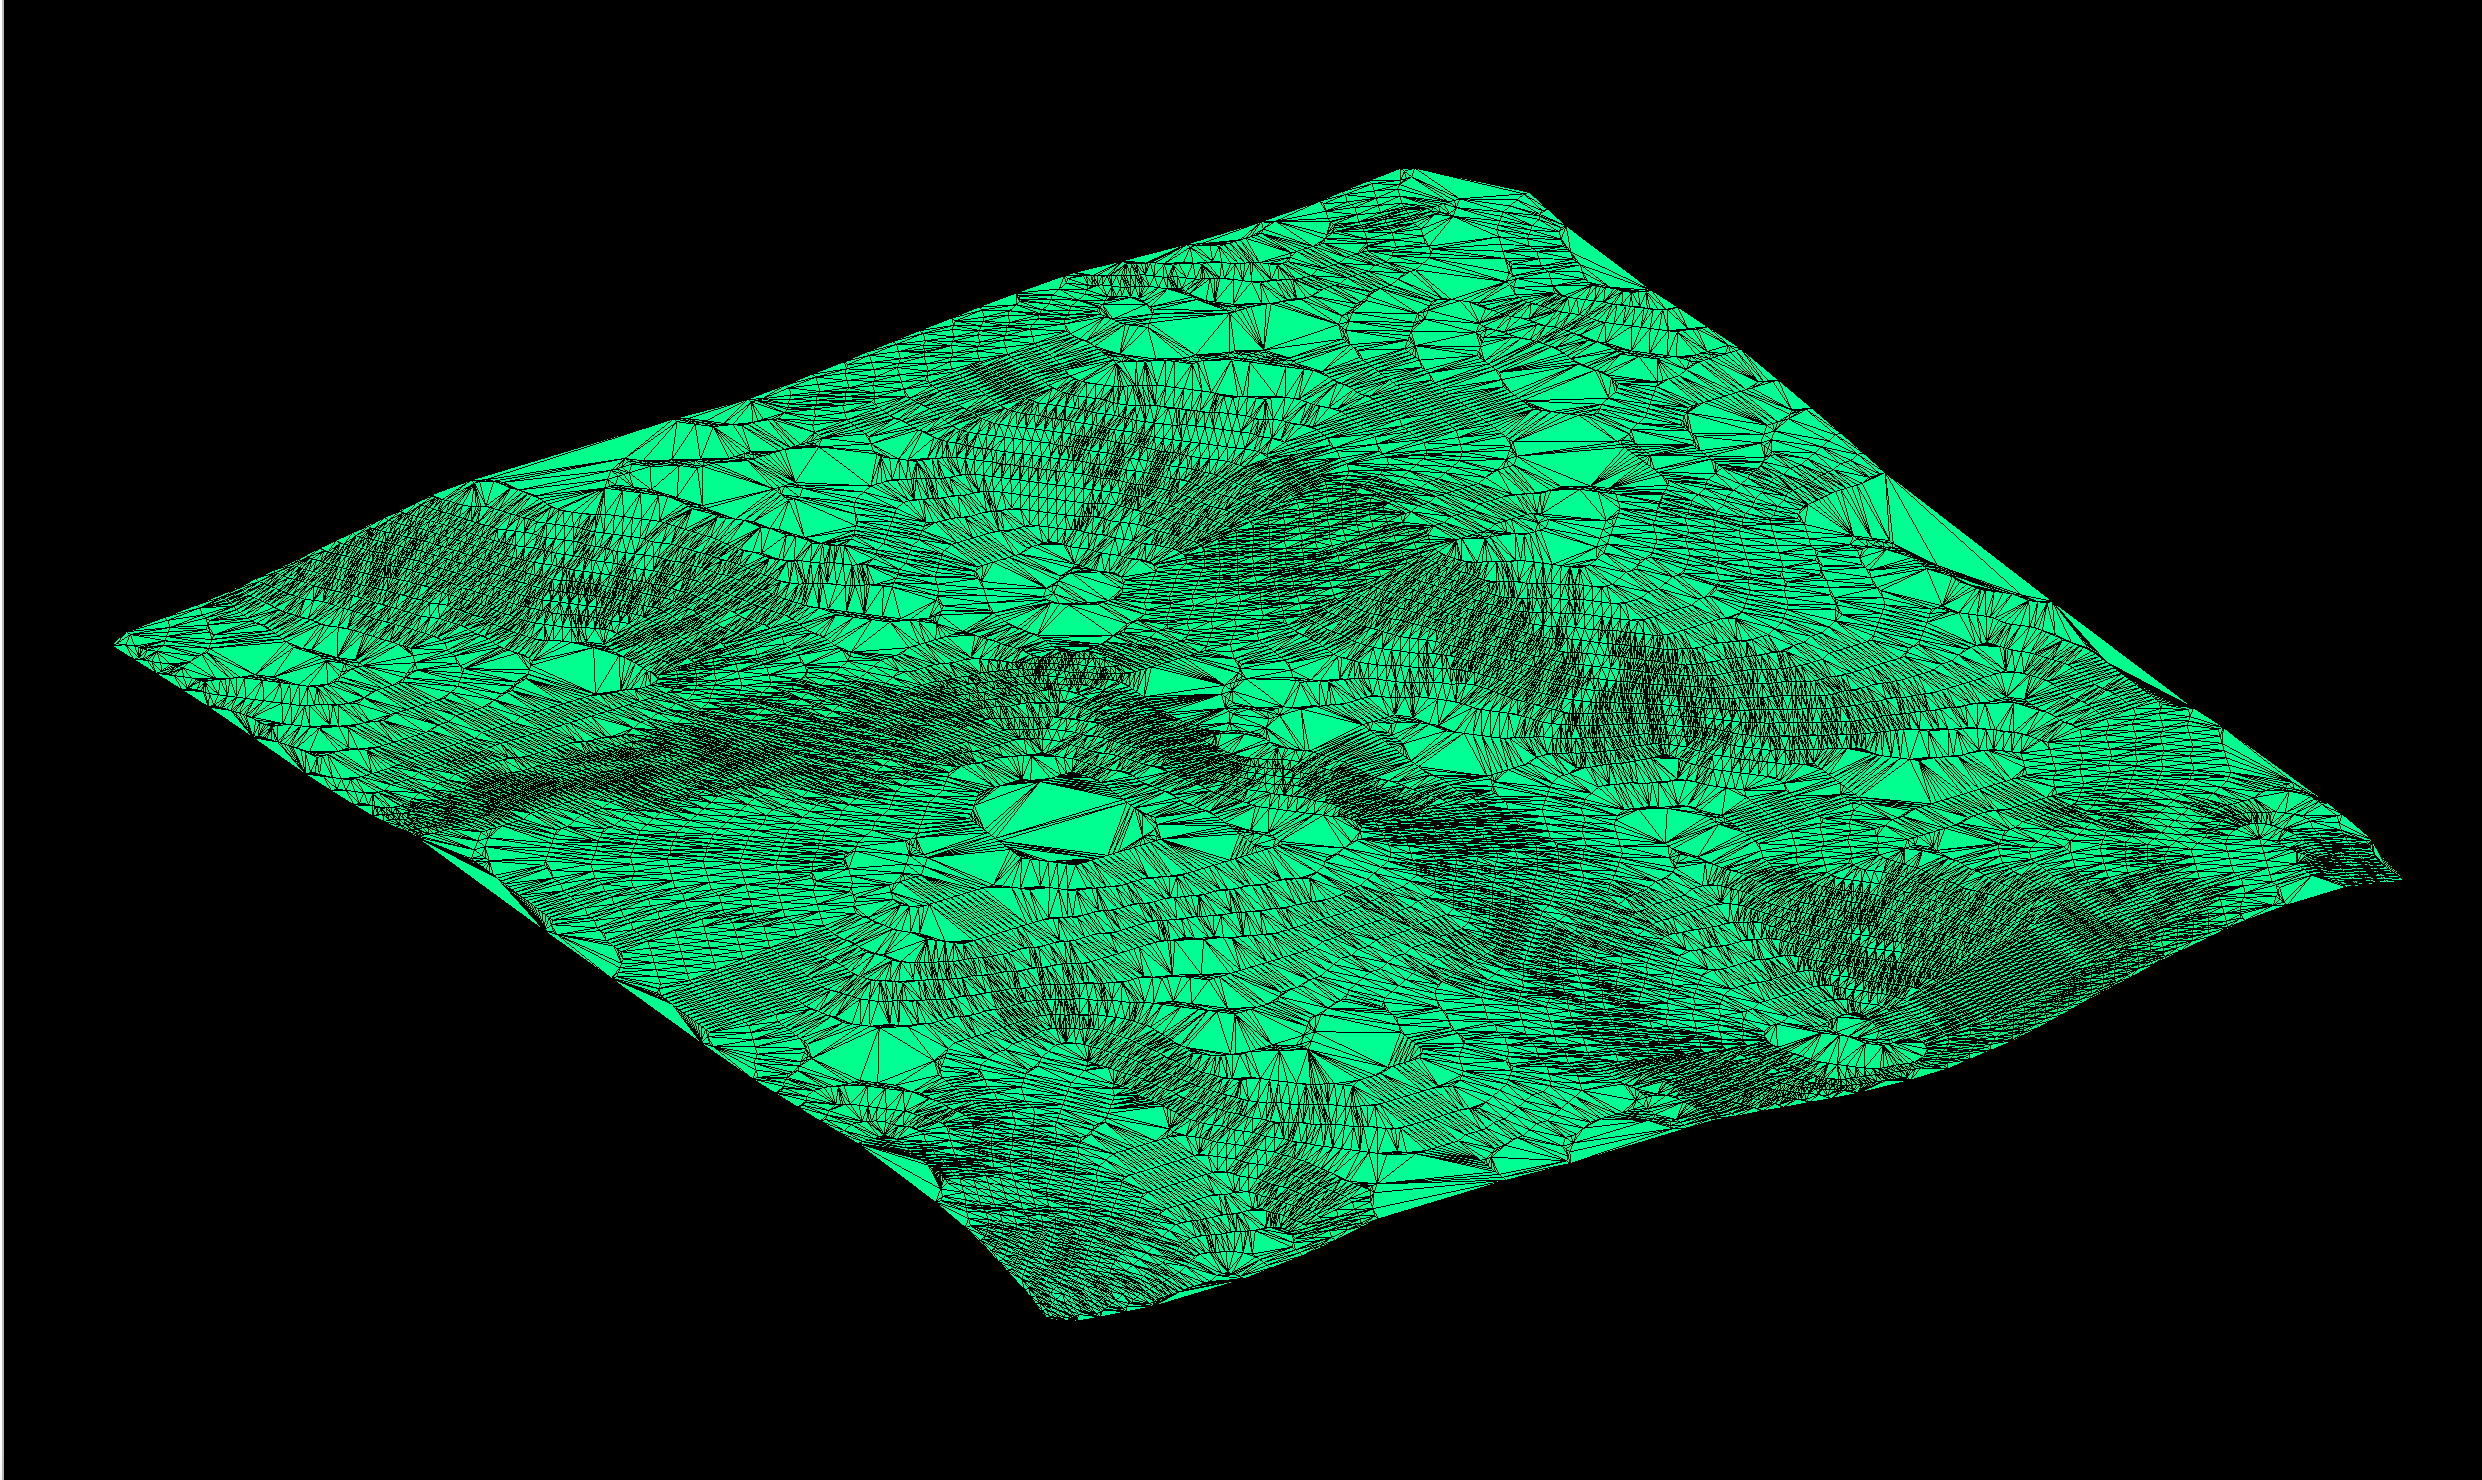
This set of images presents the mesh generated from GPS data corresponding to the tile with coordinates (x, y) = (33809, 23527) at zoom level 16, which includes the location at longitude 5.7232 and latitude 45.1835, located in Grenoble, France:n the mesh.
Here’s the visualization of the mesh generated from GPS data corresponding to the same location, but with a zoom of level 15, which provides a broader view of the terrain but with lower elevation detail.
Here’s the result for a tile in Strasbourg City Center, France (latitude: 48.582380 and longitude 7.748242 at zoom 16) which corresponds to a very flat area:
Here at zoom 15
4. Conclusion
These visualizations confirm the effectiveness of the methods used for mesh generation, contour constraint application, and triangulation refinement, resulting in high-quality, accurate terrain meshes suitable for further simulation or analysis.
References
-
[cemosis] Cemosis. Center for Modeling and Simulation in Strasbourg. 2024. (www.cemosis.fr)
-
[irma] IRMA. Institut de recherche mathématique avancée. 2024 (irma.math.unistra.fr)
-
[unistra] University of Strasbourg. 2024. (en.unistra.fr)
-
[numpex] PEPR Numpex. Priority Research Program and Equipment for Numerical Exascale computing. 2024. (numpex.org/numpex-program)
-
[exama] Exa-MA. Methods and Algorithms for Exascale. 2024. (numpex.org/exama-methods-and-algorithms-for-exascale)
-
[ktirio] Ktirio Urban Building application. Prud’homme Christophe. Expanding horizons: Ktirio and the urban building vision in Hidalgo2. October 2023. 2024. (github.com/orgs/feelpp/discussions/2167)
-
[hidalgo2] CoE Hidalgo2. HPC and big data technologies for global challenges. 2024. (www.hidalgo2.eu/about)
-
[ubm] CoE Hidalgo2. The Urban Building Model 2024. (www.hidalgo2.eu/urban-building-model)
-
[inria] Inria. National Institute for Research in Digital Science and Technology. 2024. (www.inria.fr/en)
-
[eea1] European Environment Agency. Greenhouse gas emissions from energy use in buildings in Europe. Octber 2023. 2024. (www.eea.europa.eu/en/analysis/indicators/greenhouse-gas-emissions-from-energy?activeAccordion=546a7c35-9188-4d23-94ee-005d97c26f2b)
-
[eea2] European Environment Agency. Accelerating the energy efficiency renovation of residential buildings — a behavioural approach. June 2023. 2024. (www.eea.europa.eu/publications/accelerating-the-energy-efficiency)
-
[ec1] European Commission. 2050 long-term strategy. 2024. (climate.ec.europa.eu/eu-action/climate-strategies-targets/2050-long-term-strategy_en#:~:text=Striving%20to%20become%20the%20world’s%20first%20climate%2Dneutral%20continent%20by%202050.&text=The%20EU%20aims%20to%20be,to%20the%20European%20Climate%20Law%20.)
-
[ec2] European Commission. The European Green Deal. 2024. (commission.europa.eu/strategy-and-policy/priorities-2019-2024/european-green-deal_en)
-
[ec3] European Commission. European Climate Law. 2024. (climate.ec.europa.eu/eu-action/european-climate-law_en)
-
[ubp] Urban Building Pilot. Prud’homme Christophe. CoE Hidalgo2 Urban Building Pilot at NumPEx workshop on Discretization@Exascale. November 2023. 2024. (github.com/orgs/feelpp/discussions/2188)
-
[eurohpc] EuroHPC JU. The European High Performance Computing Joint Undertaking. 2024. (eurohpc-ju.europa.eu/index_en)
-
[mapbox] Wikipedia contributors. Mapbox. Wikipedia, The Free Encyclopedia. August 2024. 2024. (en.wikipedia.org/wiki/Mapbox)
-
[mapbox-terrain-rgb] Mapbox. Mapbox Terrain-RGB v1. Mapbox Documentation. 2024. (docs.mapbox.com/data/tilesets/reference/mapbox-terrain-rgb-v1)
-
[mapbox-raster-tiles] Mapbox. Mapbox Raster Tiles API. Mapbox Documentation. 2024. (docs.mapbox.com/api/maps/raster-tiles)
-
[json-nlohmann] Lohmann, Niels. JSON for Modern C++. 2024. (json.nlohmann.me)
-
[curl] Stenberg, Daniel. cURL: A Command Line Tool and Library for Transferring Data with URLs. 2024. (curl.se)
-
[libpng] libpng: The Official PNG Reference Library. 2024. (www.libpng.org/pub/png/libpng.html)
-
[cgal] CGAL: The Computational Geometry Algorithms Library. 2024. (www.cgal.org)
-
[stl] STL (STereoLithography) File Format Specification. 2024. (www.fabbers.com/tech/STL_Format)
-
[gmsh] Geuzaine Christophe, and Jean-François Remacle. Gmsh: A 3D Finite Element Mesh Generator with Built-in Pre- and Post-Processing Facilities. Version 4.10, 2024. (gmsh.info)
-
[msh] MSH: The Gmsh Mesh File Format. 2024. (gmsh.info/doc/texinfo/gmsh.html#MSH-file-format)
-
[img:lat-lon] Latitude and Longitude. BBC Bitesize. 2024. (www.bbc.co.uk/bitesize/guides/ztqtyrd/revision/1)
-
[world-geodetic-system] Wikipedia contributors. World Geodetic System. Wikipedia, The Free Encyclopedia. 2024. (en.wikipedia.org/wiki/World_Geodetic_System)
-
[marcator-projection] Wikipedia contributors. Mercator projection. Wikipedia, The Free Encyclopedia. 2024. (en.wikipedia.org/wiki/Mercator_projection)
-
[web-marcator-projection] Wikipedia contributors. Web Mercator projection. Wikipedia, The Free Encyclopedia. 2024. (en.wikipedia.org/wiki/Web_Mercator_projection)
-
[cdt1] Wikipedia contributors. Constrained Delaunay triangulation. Wikipedia, The Free Encyclopedia. 2024. (en.wikipedia.org/wiki/Constrained_Delaunay_triangulation)
-
[cdt2] L. Paul Chew. Constrained Delaunay Triangulations. Dartmouth College. 1987. 2024. (www.cs.jhu.edu/~misha/Spring16/Chew87.pdf)
-
[dt] Wikipedia contributors. Delaunay triangulation. Wikipedia, The Free Encyclopedia. 2024. (en.wikipedia.org/wiki/Voronoi_diagram)
-
[voronoi] Wikipedia contributors. Voronoi diagram. Wikipedia, The Free Encyclopedia. 2024. ()
-
[tiled-web-map] Wikipedia contributors. Tiled web map. Wikipedia, The Free Encyclopedia. 2024. (en.wikipedia.org/wiki/Tiled_web_map)
-
[img:tiles-coordinates] XYZ Tiles coordinate numbers. Wikipedia, The Free Encyclopedia. 2024. (en.wikipedia.org/wiki/File:XYZ_Tiles.png)
-
[img:tiled-web-map] Tiled Web Map. Wikipedia, The Free Encyclopedia. 2024. (en.wikipedia.org/wiki/Tiled_web_map#/media/File:Tiled_web_map_Stevage.png)
-
[img:dt] Delaunay triangulation. Wikipedia, The Free Encyclopedia. 2024. (en.wikipedia.org/wiki/Delaunay_triangulation#/media/File:Delaunay_circumcircles_vectorial.svg)
-
[img:dt-centers] Delaunay triangulation with all the circumcircles and their centers. Wikipedia, The Free Encyclopedia. 2024. (en.wikipedia.org/wiki/Delaunay_triangulation#/media/File:Delaunay_circumcircles_centers.svg)
-
[img:dt-voronoi] Delaunay triangulation and its Voronoi diagram. Wikipedia, The Free Encyclopedia. 2024. (en.wikipedia.org/wiki/Delaunay_triangulation#/media/File:Delaunay_Voronoi.svg)
-
[img:constrained-mesh] Pierre Alliez, Senior Researcher and Team Leader at Inria, Image provided during personal communication. 2024.
-
[img:constrained-refined-mesh] Pierre Alliez, Senior Researcher and Team Leader at Inria, Image provided during personal communication. 2024.