 .pdf
.pdf
Understanding map and tiles coordinates
1. World coordinates and the mercator projection
World coordinates provide a way to reference points uniquely on the map using latitude and longitude.
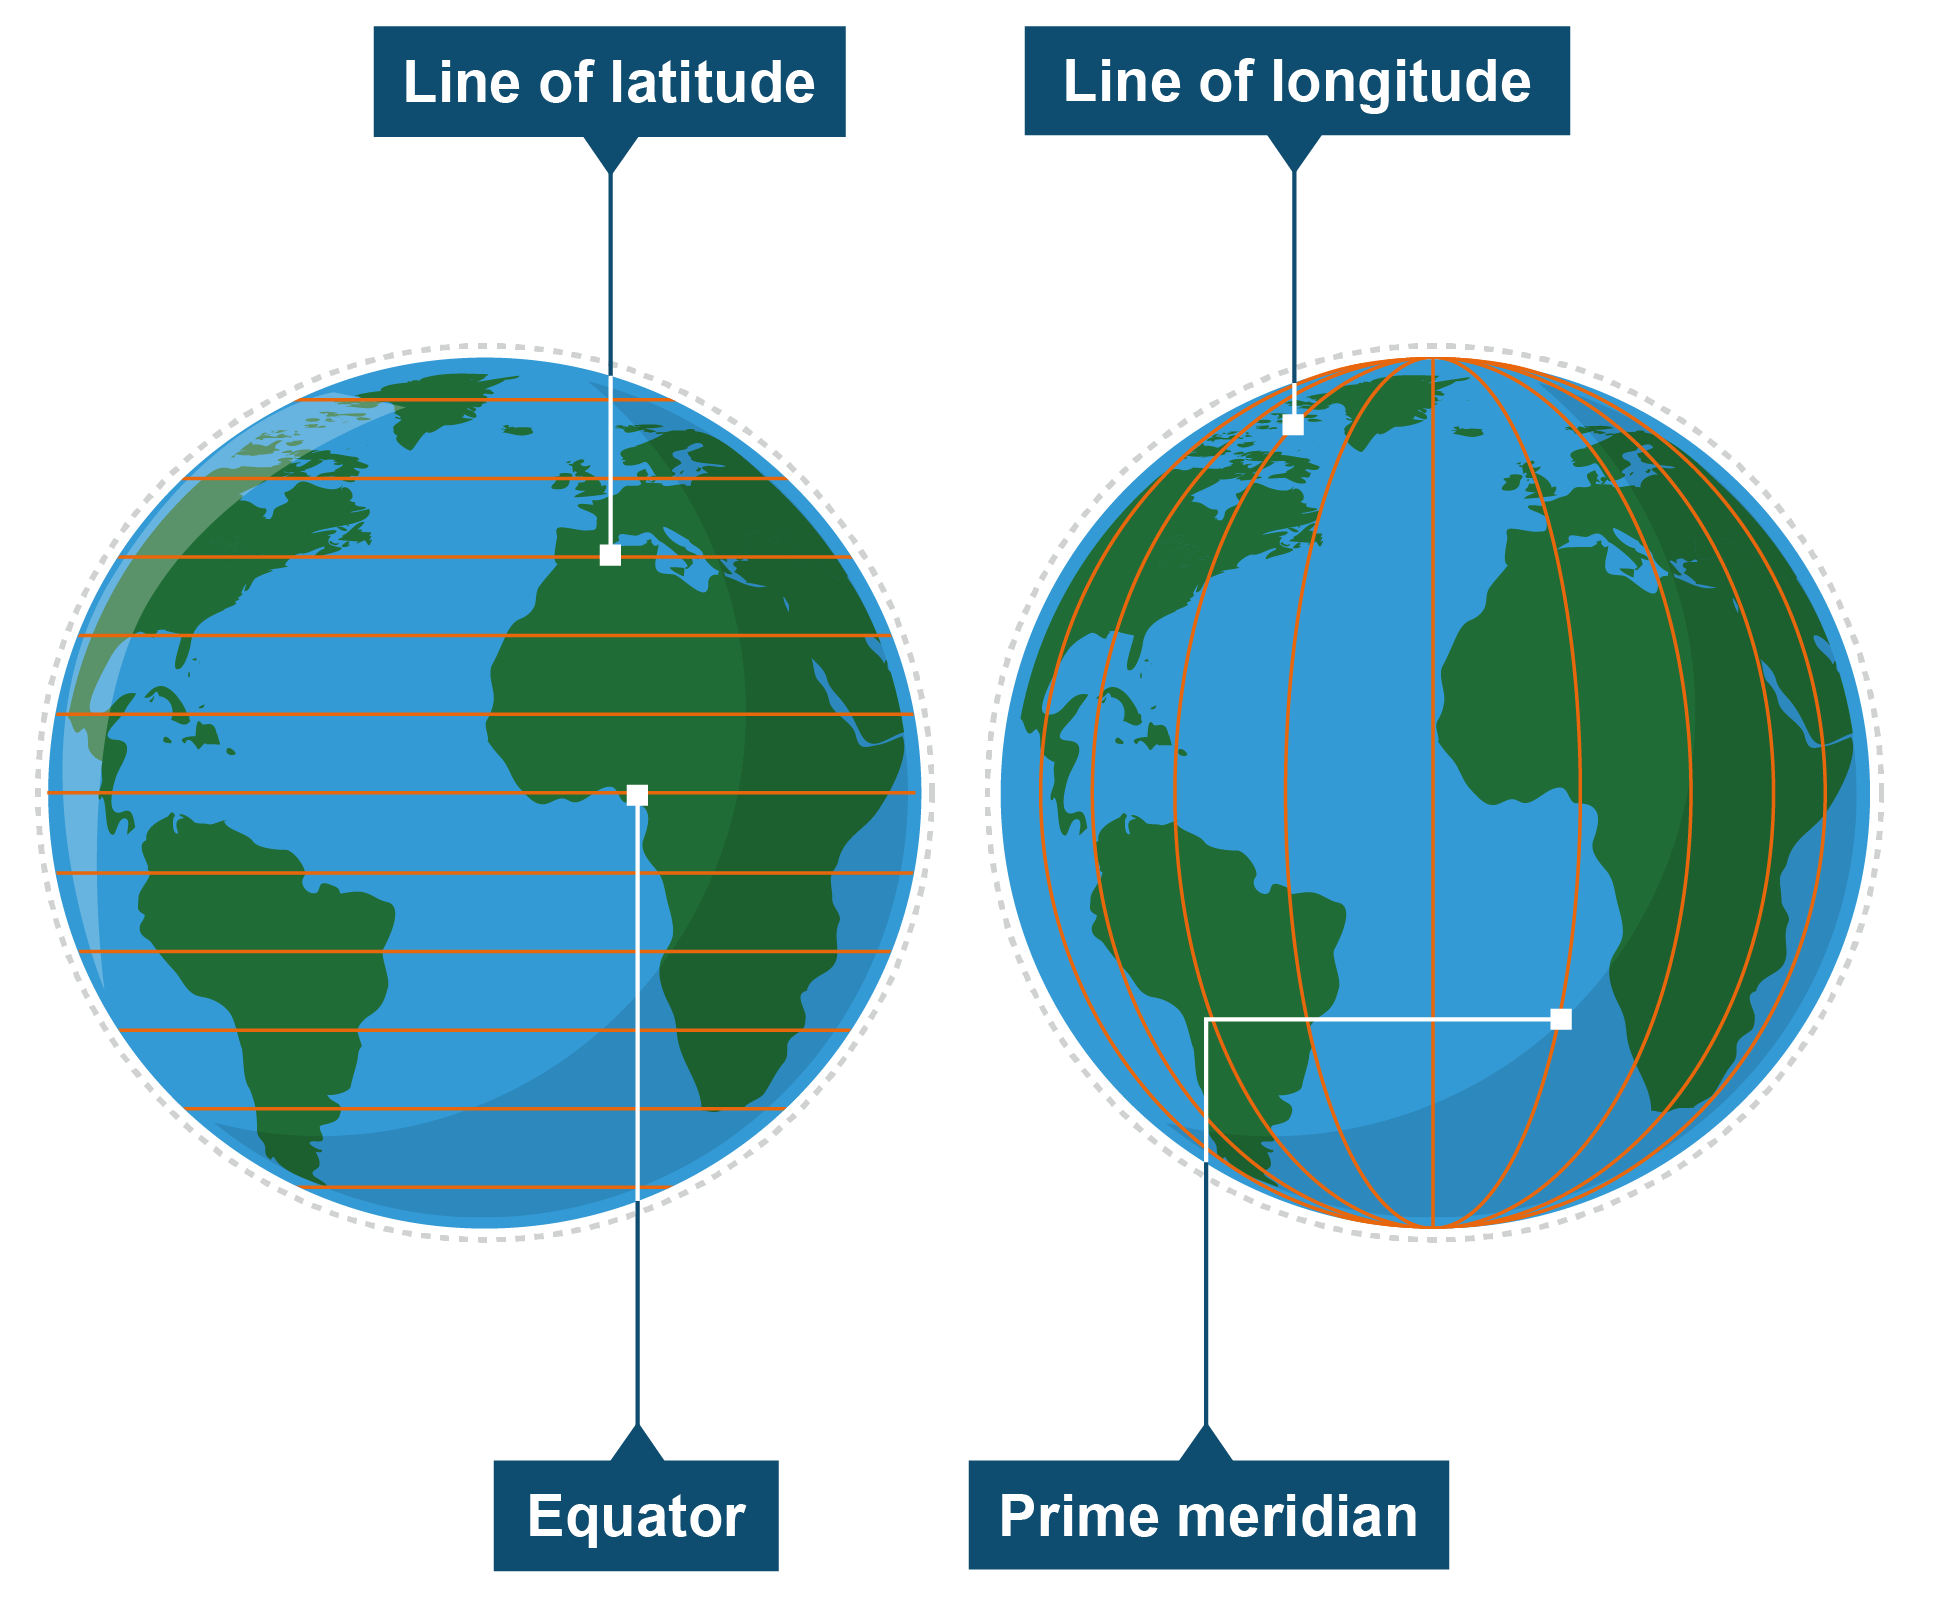
Providers of custom online maps like Mapbox employ the World Geodetic System (WGS84) standard for this purpose (source). To convert these geographical coordinates into world coordinates, the Mercator projection is used. This projection translates latitudes and longitudes into pixel positions on a base tile, assuming a map at zoom level 0 is a single \(256 \times 256\) pixel tile covering the entire world.
World coordinates are floating point values that measure from the Mercator projection’s origin, situated at the northwest corner of the map (180 degrees longitude and approximately 85 degrees latitude), increasing eastward (right) and southward (down). Since these values are floating point, they provide high precision beyond the current map resolution, independent of the zoom level.
2. Tiled web maps
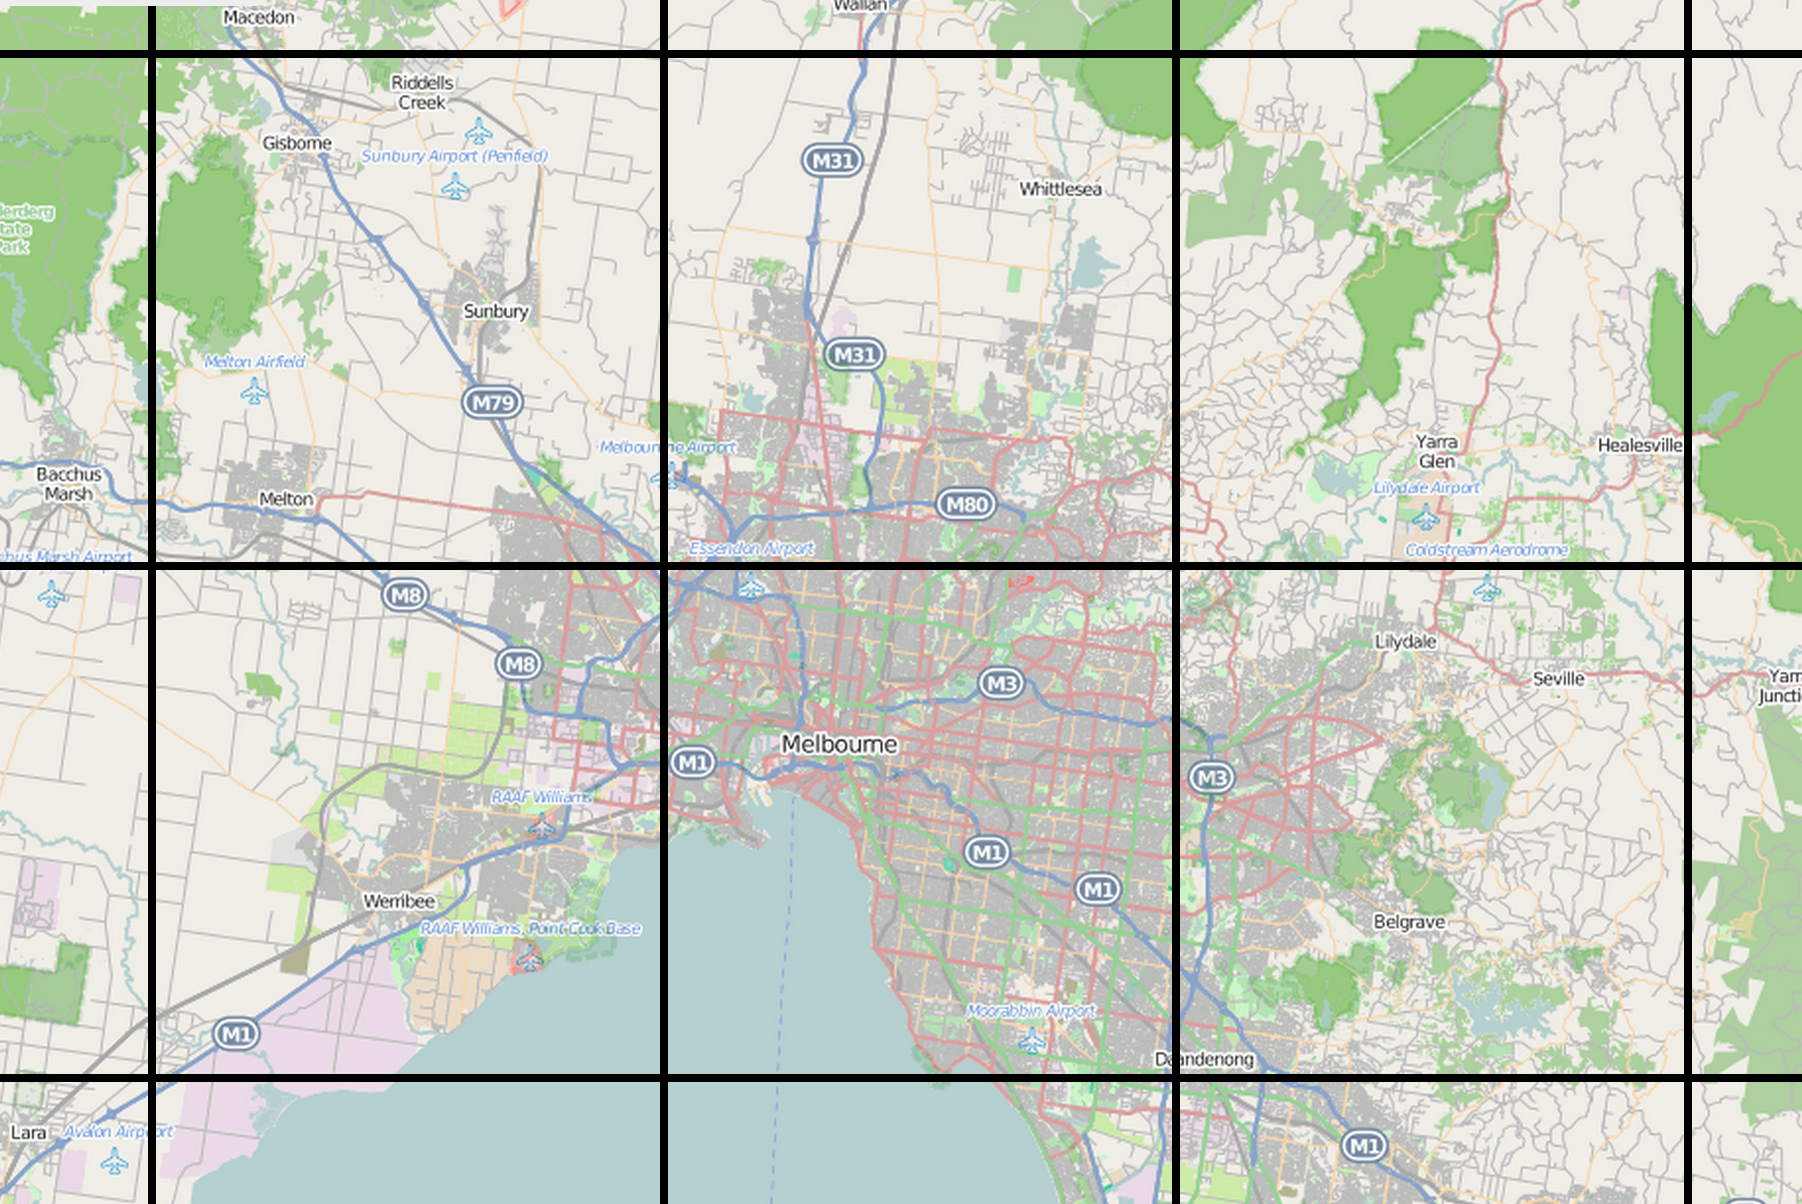
A tiled web map is a map displayed in a web browser by seamlessly joining dozens of individually requested image or vector data files. This method is the most popular way to display and navigate maps on the web, as it allows for smooth interaction and navigation (source).
There are several advantages to tiled maps. Each time the user pans, most of the tiles remain relevant and can be kept displayed while new tiles are fetched. This improves the user experience compared to fetching a single map image for the whole viewport. Additionally, individual tiles can be pre-computed, which is a task easy to parallelize (source).
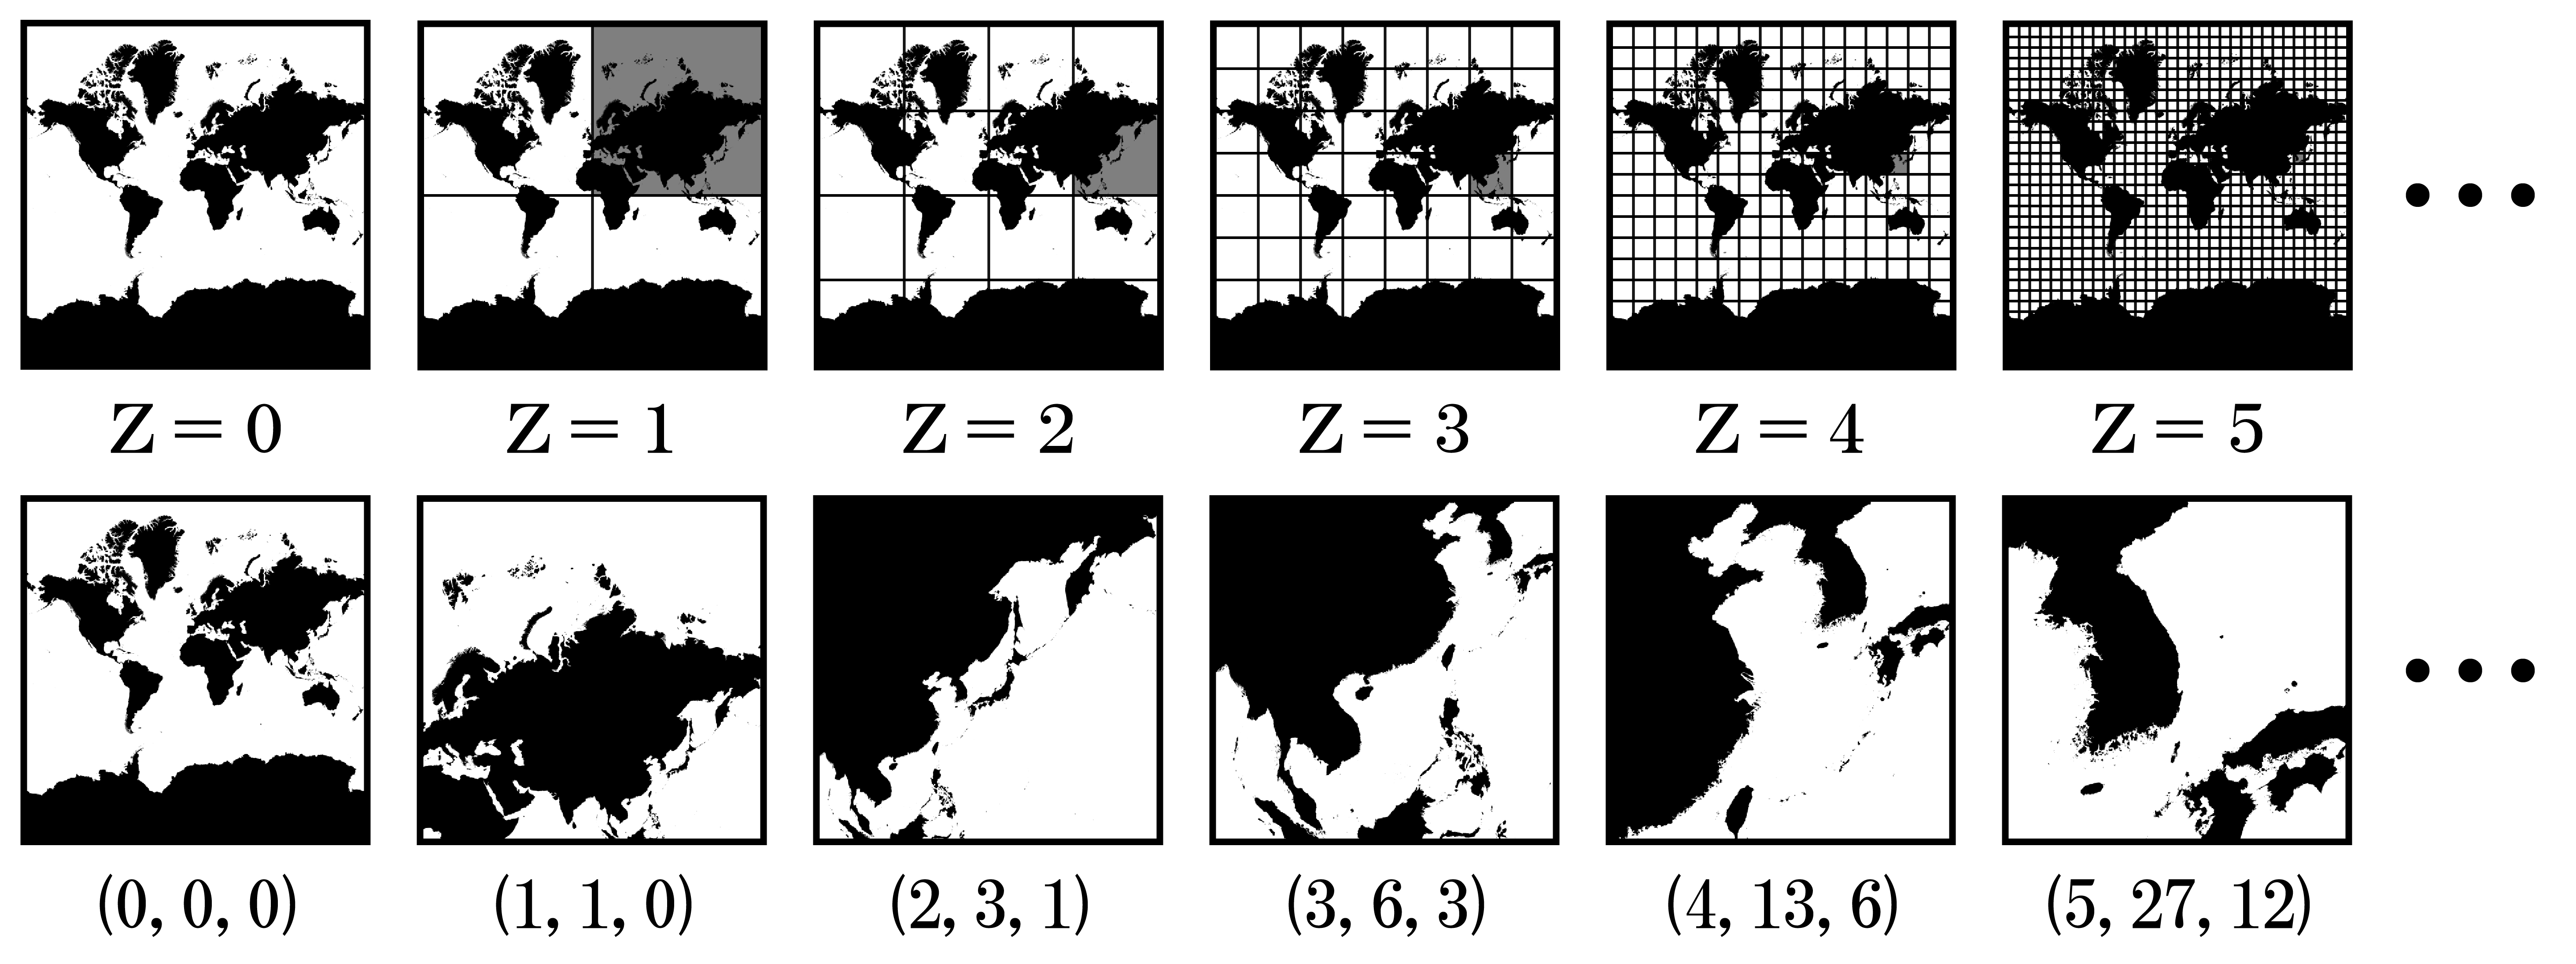
Tiles are typically \(256 \times 256\) pixels in size. At the outermost zoom level (0), the entire world can be rendered in a single map tile. As the zoom level increases, each tile is replaced by four tiles, resulting in more detailed maps (source).
3. Pixel coordinates
Pixel coordinates reference specific pixels on the map at a given zoom level. They are calculated from world coordinates using the formula:
Each increment in zoom level doubles the map’s resolution in both the x and y directions, quadrupling the number of pixels. For instance, at zoom level 1, the map comprises 4 tiles of \(256 \times 256\) pixels, resulting in a total pixel space of \(512 \times 512\). At zoom level 19, the pixel space ranges from 0 to \(256 \times 2^{19}\).
By basing world coordinates on the map’s tile size, pixel coordinates at zoom level 0 are equivalent to world coordinates. This system allows precise referencing of each location on the map at any zoom level.
4. Tile coordinates
Tile coordinates are used to reference specific tiles on a tiled web map. Tiles are numbered from the same origin as pixels, with the northwest corner as the origin. X values increase from west to east, and y values increase from north to south.
At zoom level 2, for example, the world is divided into 16 tiles, each uniquely identified by an x, y pair. Tile coordinates are derived by dividing pixel coordinates by the tile size (256) and taking the integer part of the result. This process simplifies determining which tile contains the required map imagery at any given point.
5. Geographic coordinates to tile coordinates
To convert geographic coordinates (latitude and longitude) to tile coordinates (x and y), the following formulas are used:
6. Tile coordinates to geographic coordinates
To convert tile coordinates back to geographic coordinates, the following formulas are used:
7. RGB values in pixels and altitude conversion
Each pixel in a raster image contains RGB (Red, Green, Blue) values. These values range from 0 to 255, representing the intensity of the respective color components. In elevation maps, the RGB values are often used to encode the altitude information.
To convert RGB values to altitude, a common formula is used:
References
-
[cemosis] Cemosis. Center for Modeling and Simulation in Strasbourg. 2024. (www.cemosis.fr)
-
[irma] IRMA. Institut de recherche mathématique avancée. 2024 (irma.math.unistra.fr)
-
[unistra] University of Strasbourg. 2024. (en.unistra.fr)
-
[numpex] PEPR Numpex. Priority Research Program and Equipment for Numerical Exascale computing. 2024. (numpex.org/numpex-program)
-
[exama] Exa-MA. Methods and Algorithms for Exascale. 2024. (numpex.org/exama-methods-and-algorithms-for-exascale)
-
[ktirio] Ktirio Urban Building application. Prud’homme Christophe. Expanding horizons: Ktirio and the urban building vision in Hidalgo2. October 2023. 2024. (github.com/orgs/feelpp/discussions/2167)
-
[hidalgo2] CoE Hidalgo2. HPC and big data technologies for global challenges. 2024. (www.hidalgo2.eu/about)
-
[ubm] CoE Hidalgo2. The Urban Building Model 2024. (www.hidalgo2.eu/urban-building-model)
-
[inria] Inria. National Institute for Research in Digital Science and Technology. 2024. (www.inria.fr/en)
-
[eea1] European Environment Agency. Greenhouse gas emissions from energy use in buildings in Europe. Octber 2023. 2024. (www.eea.europa.eu/en/analysis/indicators/greenhouse-gas-emissions-from-energy?activeAccordion=546a7c35-9188-4d23-94ee-005d97c26f2b)
-
[eea2] European Environment Agency. Accelerating the energy efficiency renovation of residential buildings — a behavioural approach. June 2023. 2024. (www.eea.europa.eu/publications/accelerating-the-energy-efficiency)
-
[ec1] European Commission. 2050 long-term strategy. 2024. (climate.ec.europa.eu/eu-action/climate-strategies-targets/2050-long-term-strategy_en#:~:text=Striving%20to%20become%20the%20world’s%20first%20climate%2Dneutral%20continent%20by%202050.&text=The%20EU%20aims%20to%20be,to%20the%20European%20Climate%20Law%20.)
-
[ec2] European Commission. The European Green Deal. 2024. (commission.europa.eu/strategy-and-policy/priorities-2019-2024/european-green-deal_en)
-
[ec3] European Commission. European Climate Law. 2024. (climate.ec.europa.eu/eu-action/european-climate-law_en)
-
[ubp] Urban Building Pilot. Prud’homme Christophe. CoE Hidalgo2 Urban Building Pilot at NumPEx workshop on Discretization@Exascale. November 2023. 2024. (github.com/orgs/feelpp/discussions/2188)
-
[eurohpc] EuroHPC JU. The European High Performance Computing Joint Undertaking. 2024. (eurohpc-ju.europa.eu/index_en)
-
[mapbox] Wikipedia contributors. Mapbox. Wikipedia, The Free Encyclopedia. August 2024. 2024. (en.wikipedia.org/wiki/Mapbox)
-
[mapbox-terrain-rgb] Mapbox. Mapbox Terrain-RGB v1. Mapbox Documentation. 2024. (docs.mapbox.com/data/tilesets/reference/mapbox-terrain-rgb-v1)
-
[mapbox-raster-tiles] Mapbox. Mapbox Raster Tiles API. Mapbox Documentation. 2024. (docs.mapbox.com/api/maps/raster-tiles)
-
[json-nlohmann] Lohmann, Niels. JSON for Modern C++. 2024. (json.nlohmann.me)
-
[curl] Stenberg, Daniel. cURL: A Command Line Tool and Library for Transferring Data with URLs. 2024. (curl.se)
-
[libpng] libpng: The Official PNG Reference Library. 2024. (www.libpng.org/pub/png/libpng.html)
-
[cgal] CGAL: The Computational Geometry Algorithms Library. 2024. (www.cgal.org)
-
[stl] STL (STereoLithography) File Format Specification. 2024. (www.fabbers.com/tech/STL_Format)
-
[gmsh] Geuzaine Christophe, and Jean-François Remacle. Gmsh: A 3D Finite Element Mesh Generator with Built-in Pre- and Post-Processing Facilities. Version 4.10, 2024. (gmsh.info)
-
[msh] MSH: The Gmsh Mesh File Format. 2024. (gmsh.info/doc/texinfo/gmsh.html#MSH-file-format)
-
[img:lat-lon] Latitude and Longitude. BBC Bitesize. 2024. (www.bbc.co.uk/bitesize/guides/ztqtyrd/revision/1)
-
[world-geodetic-system] Wikipedia contributors. World Geodetic System. Wikipedia, The Free Encyclopedia. 2024. (en.wikipedia.org/wiki/World_Geodetic_System)
-
[marcator-projection] Wikipedia contributors. Mercator projection. Wikipedia, The Free Encyclopedia. 2024. (en.wikipedia.org/wiki/Mercator_projection)
-
[web-marcator-projection] Wikipedia contributors. Web Mercator projection. Wikipedia, The Free Encyclopedia. 2024. (en.wikipedia.org/wiki/Web_Mercator_projection)
-
[cdt1] Wikipedia contributors. Constrained Delaunay triangulation. Wikipedia, The Free Encyclopedia. 2024. (en.wikipedia.org/wiki/Constrained_Delaunay_triangulation)
-
[cdt2] L. Paul Chew. Constrained Delaunay Triangulations. Dartmouth College. 1987. 2024. (www.cs.jhu.edu/~misha/Spring16/Chew87.pdf)
-
[dt] Wikipedia contributors. Delaunay triangulation. Wikipedia, The Free Encyclopedia. 2024. (en.wikipedia.org/wiki/Voronoi_diagram)
-
[voronoi] Wikipedia contributors. Voronoi diagram. Wikipedia, The Free Encyclopedia. 2024. ()
-
[tiled-web-map] Wikipedia contributors. Tiled web map. Wikipedia, The Free Encyclopedia. 2024. (en.wikipedia.org/wiki/Tiled_web_map)
-
[img:tiles-coordinates] XYZ Tiles coordinate numbers. Wikipedia, The Free Encyclopedia. 2024. (en.wikipedia.org/wiki/File:XYZ_Tiles.png)
-
[img:tiled-web-map] Tiled Web Map. Wikipedia, The Free Encyclopedia. 2024. (en.wikipedia.org/wiki/Tiled_web_map#/media/File:Tiled_web_map_Stevage.png)
-
[img:dt] Delaunay triangulation. Wikipedia, The Free Encyclopedia. 2024. (en.wikipedia.org/wiki/Delaunay_triangulation#/media/File:Delaunay_circumcircles_vectorial.svg)
-
[img:dt-centers] Delaunay triangulation with all the circumcircles and their centers. Wikipedia, The Free Encyclopedia. 2024. (en.wikipedia.org/wiki/Delaunay_triangulation#/media/File:Delaunay_circumcircles_centers.svg)
-
[img:dt-voronoi] Delaunay triangulation and its Voronoi diagram. Wikipedia, The Free Encyclopedia. 2024. (en.wikipedia.org/wiki/Delaunay_triangulation#/media/File:Delaunay_Voronoi.svg)
-
[img:constrained-mesh] Pierre Alliez, Senior Researcher and Team Leader at Inria, Image provided during personal communication. 2024.
-
[img:constrained-refined-mesh] Pierre Alliez, Senior Researcher and Team Leader at Inria, Image provided during personal communication. 2024.